New Marquette Law School national survey finds Trump holding steady among Republicans, DeSantis remaining clear second choice in party, and a tie in Biden/Trump head-to-head
July 27, 2023
Please note: Complete Poll results and methodology information can be found online at law.marquette.edu/poll
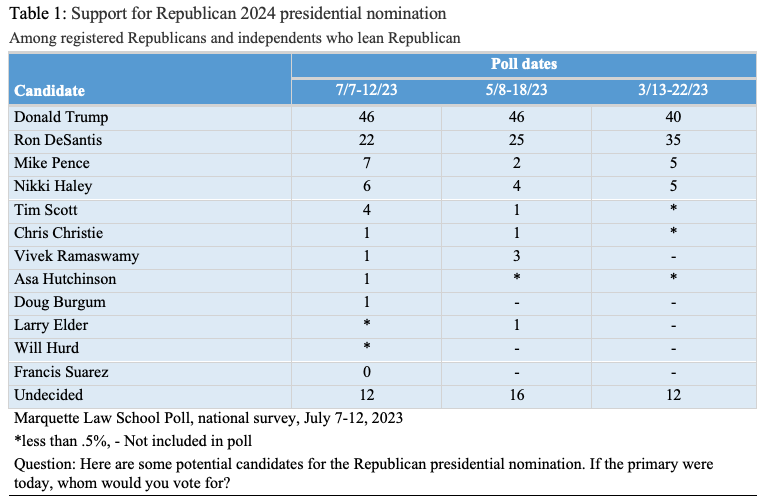
MILWAUKEE — A new Marquette Law School Poll national survey finds that former President Donald Trump has increased his support for the Republican nomination since March. In July, Florida Gov. Ron DeSantis is the choice of 22%, down from 25% in May and 35% in March, among all Republicans and independents who lean Republicans and are registered to vote (hereafter “Republican voters”). No other Republican candidate is close to either Trump or DeSantis. Trump’s support for the nomination in July is 46%, unchanged from May, but up from 40% in March. The support for each candidate, and the trends since March, are shown in Table 1.
Other headlines
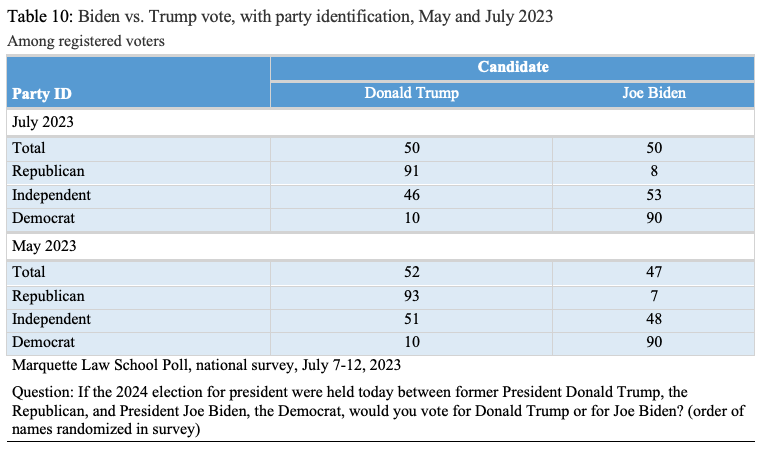
- In a potential rematch of the 2020 presidential election between President Joe Biden and Trump, registered voters were evenly split, with each candidate receiving 50% support.
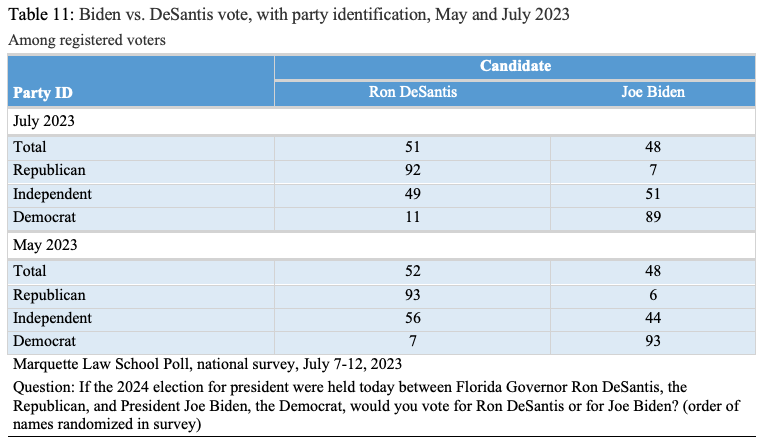
- When asked about a hypothetical Biden/DeSantis race, registered voters favored DeSantis, 51-48. There is little change since the May survey, but Biden’s support among independents saw a modest increase, from 44% to 51%.
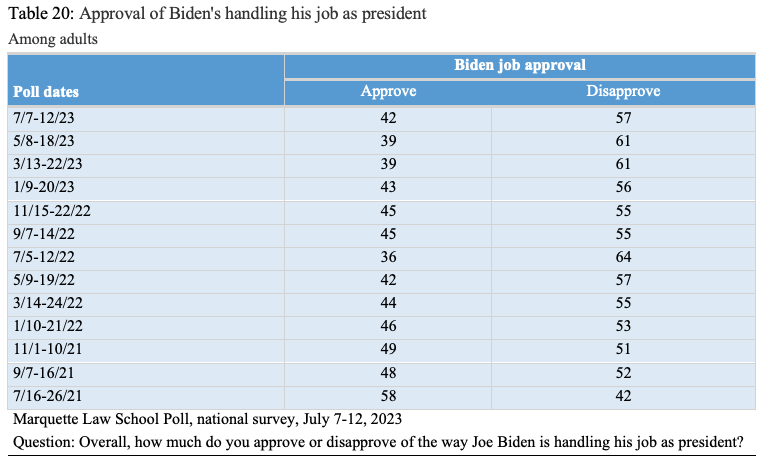
- Approval of how Biden is handling his job as president inched up slightly to 42%, in July, from 39% in May. Disapproval in July was 57%, down from 61% in May.
The latest Marquette Law School Poll’s national survey was conducted July 7-12, 2023. The survey interviewed 1,005 adults nationwide and has a margin of error of +/-4 percentage points. The margin of error is +/-4.2 percentage points for registered voters, and +/-5.8 and +/-6.7 percentage points for registered Republican and registered Democratic voters, respectively. Results related to the U.S. Supreme Court from the same survey were released on July 26.
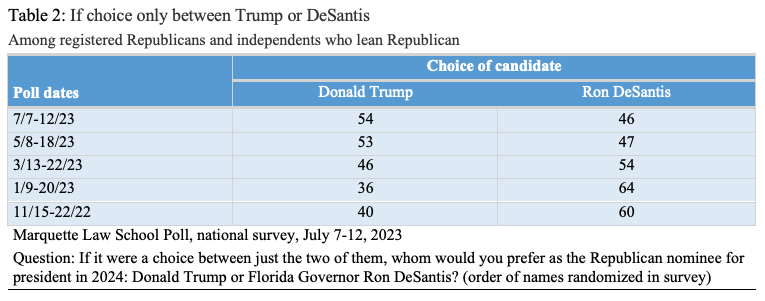
When asked if the choice were only between Trump and DeSantis, 54% of Republican voters say they would vote for Trump and 46% would support DeSantis. DeSantis held an advantage over Trump on this question in late 2022, but Trump overtook DeSantis in May, as shown in Table 2.
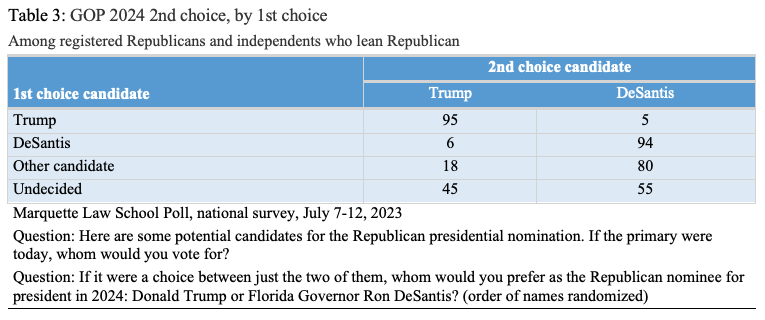
 While Trump holds just under 50% of first-choice support, and just over 50% when matched against only DeSantis, he gains little support as a second choice among initial supporters of other candidates. Table 3 shows how votes change from first to second choice among Republican voters. Those who initially prefer a candidate other than Trump or DeSantis are overwhelmingly likely to choose DeSantis rather than Trump as their second choice. Those initially undecided are more evenly split on second choices, with a slight advantage to DeSantis.
 GOP candidate favorability
Trump is viewed favorably by 69% of Republican voters and unfavorably by 30%. His favorability rating has consistently held near 70% among Republican voters in recent months, with around 30% unfavorable. There have been a decrease in favorable and an increase in unfavorable ratings, comparing January through July 2022 with the same months in 2023. The full trend is shown in Table 4.
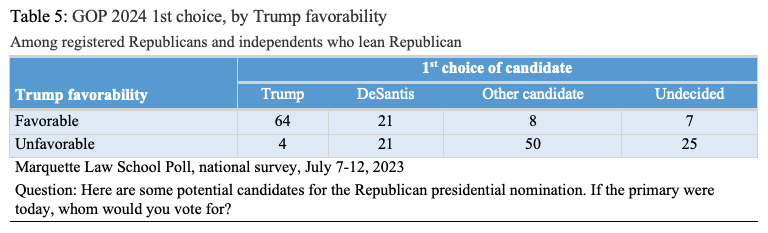
 Trump’s favorability outpaces his voter-preference figures because of defections by some of those favorable to him and majority opposition among those unfavorable to him. This is shown for the first choice among primary candidates in Table 5. Among those favorable to Trump, Trump receives 64% support, but 21% support DeSantis and 8% another candidate, with 7% undecided. Among those Republican voters unfavorable to him, Trump receives only 4% of the vote, with 22% for DeSantis and 49% for one of the other named candidates, while 26% say they are undecided.
 Republican favorability to DeSantis rose during 2022 and peaked in January 2023. It has been declining slightly since then. His unfavorable ratings have increased over time, reaching 21% in July. Meanwhile, Republican voters have become much more familiar with DeSantis, with those saying they haven’t heard enough about him now at 12%. The full trend is shown in Table 6.
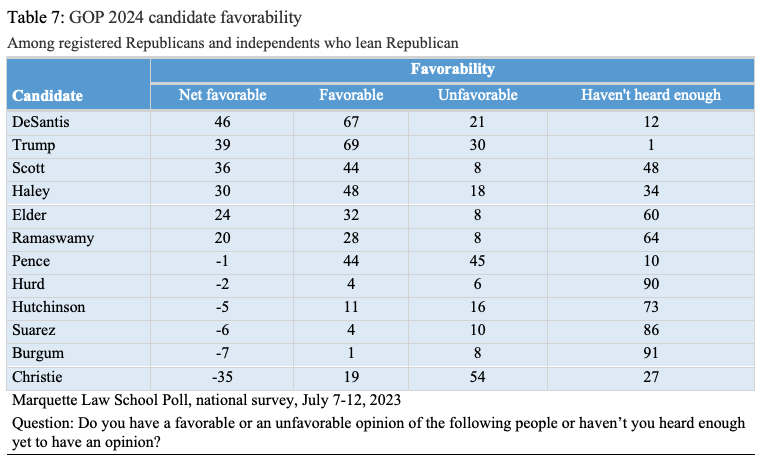
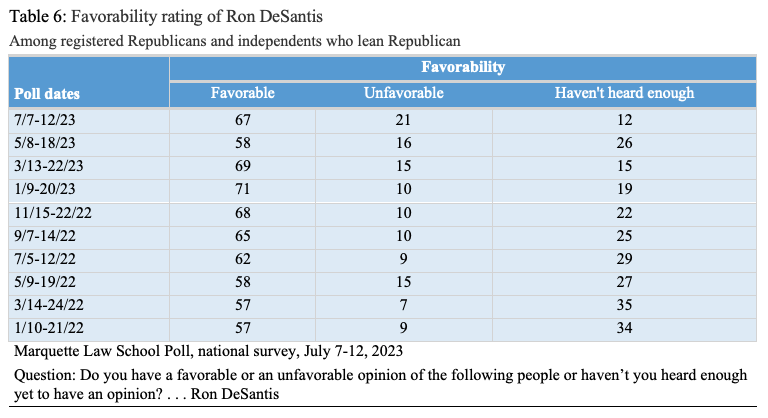 The July favorability ratings among Republican voters for all 12 Republican candidates included in the survey are shown in Table 7. Many of the candidates remain little known to Republican voters. DeSantis’ net favorability is higher than Trump’s, thanks to nearly equal favorable ratings and lower unfavorable ratings for DeSantis. More respondents lack an opinion of DeSantis than of Trump.
Democratic candidate favorability
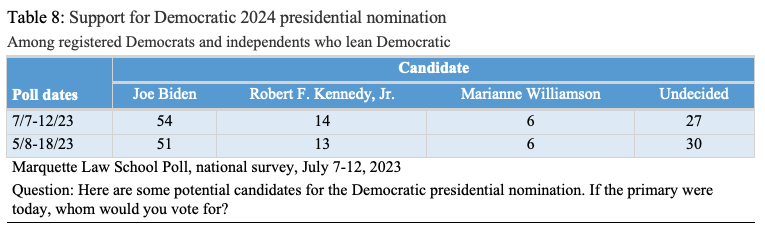
Among registered voters who are Democrats or independents who lean Democratic (hereafter “Democratic voters”), President Joe Biden is the choice for the nomination of 54%, with 14% for Robert F. Kennedy Jr., 6% for Marianne Williamson, and 27% who are undecided. There has been little change in preferences since May, as shown in Table 8.
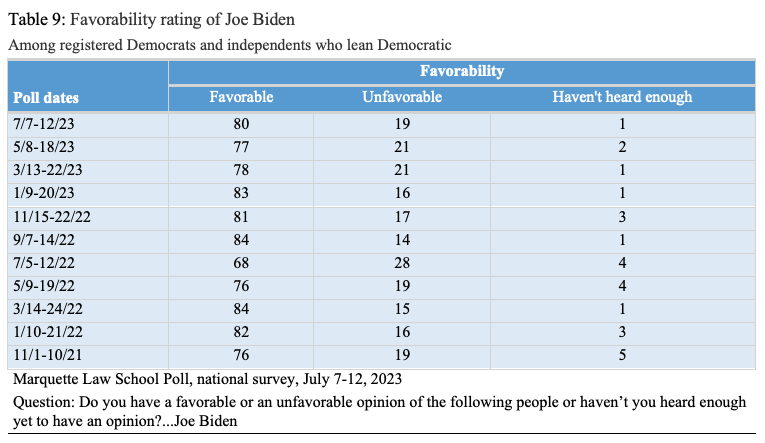
 Biden’s favorability rating among Democratic voters has remained near 80% since 2021, and his unfavorable around 20%, as shown in Table 9. In July, 80% of Democratic voters had a favorable view of Biden and 19% an unfavorable opinion. Biden’s favorability among Democrats is some 11 points higher than Trump’s favorability among Republicans.
2024 general election matchups
When asked if they had to choose between Biden and Trump for president in 2024, 50% of registered voters say they would vote for Biden and 50% would vote for Trump. There is strong party-line voting, with little crossover voting. Among independents, Biden holds a small edge over Trump. Table 10 shows the vote by party identification in the May and July surveys. In May, Trump held a slight advantage in the overall preference. (In this and subsequent tables, partisans include independents who say they are closer to that party than to the other.)
In a matchup with DeSantis, DeSantis receives 51% and Biden gets 48%, which is a slight change from May. Biden’s support among independents rose in July, as shown in Table 11.
Classified documents
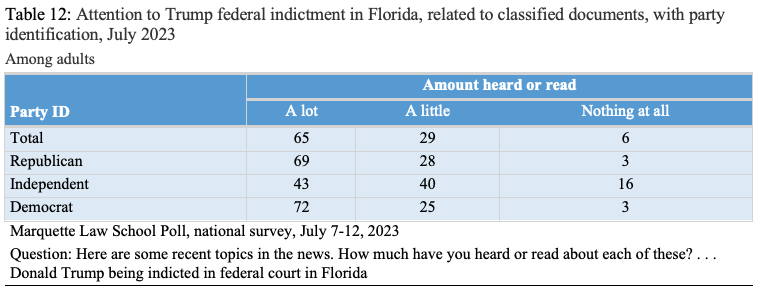
Among all adults, 65% said they have heard or read a lot about Trump’s indictment in Florida, relating to classified documents he is alleged to have kept after leaving office. Twenty-nine percent said they have heard a little and 6% said they have heard nothing at all about the indictment.
The level of attention to news about the indictment was quite similar for Republicans and Democrats, and substantially less among independents, as shown in Table 12.
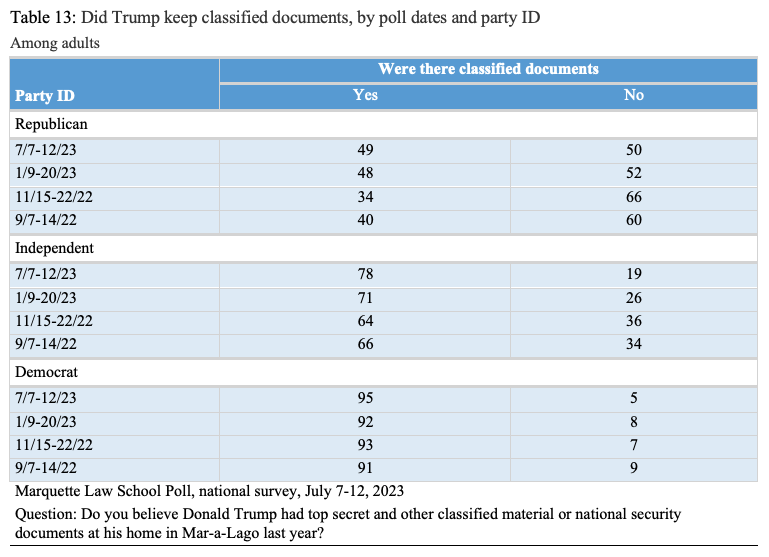
While attention to the indictment was similar among Democrats and Republicans, there are sharp partisan differences in belief whether Trump had classified documents at Mar-a-Lago in Florida. Table 13 shows the responses by party since September 2022. Republicans are now evenly divided, with 49% saying there were classified documents at Mar-a-Lago and 50% saying there were not. In September 2022, 40% of Republicans said there were such documents and 60% said there were not. Among independents, 78% now say classified documents were present, up from 66% in September 2022. Almost all Democrats, 95%, now say classified documents were present, compared to 91% saying so in September 2022.
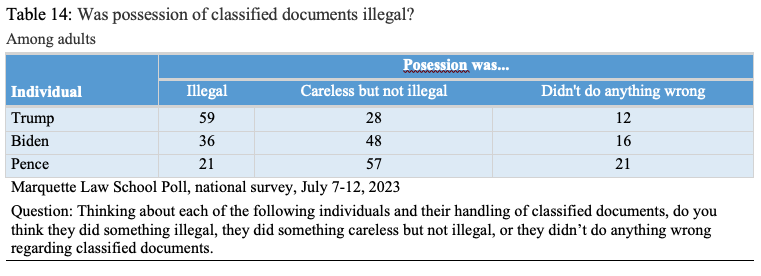
Following the search at Mar-a-Lago, classified documents were also found in the homes or offices of Biden and former Vice President Mike Pence. Respondents were asked if they thought each of the instances represented an illegal action by the individual, something careless but not illegal, or if there was nothing wrong. The results for Trump, Biden, and Pence are shown in Table 14.
Abortion
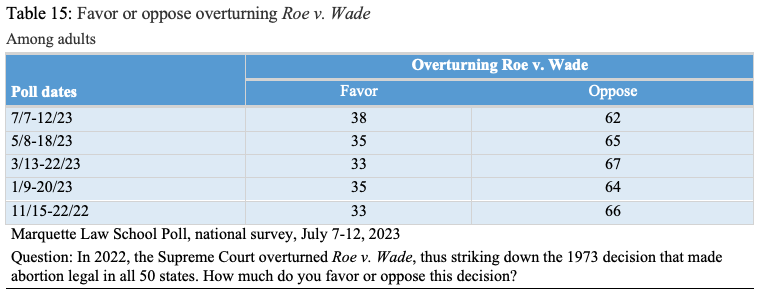
Abortion policy remains a salient issue just over a year after the U.S. Supreme Court overturned Roe v. Wade. More than 60% of adults say they are opposed to the Court’s decision, a small decline since November 2022, as shown in Table 15.
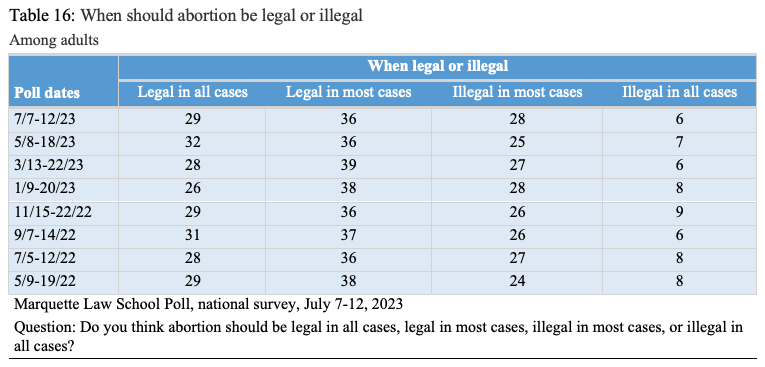
There has been little change in opinion on when abortion should be legal or illegal since May 2022, as shown in Table 16. Sixty-five percent say it should be legal in all or most cases, while 34% say it should be illegal in all or most cases. In May 2022, 67% said legal in all or most cases and 32 % said illegal in all or most cases.
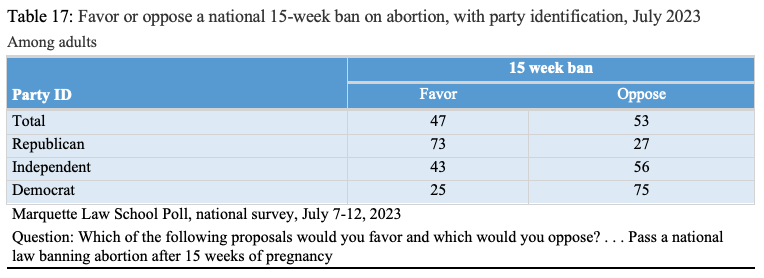
The public is closely divided on a national ban on abortions after 15 weeks of pregnancy, with strong partisan differences, as shown in Table 17. Overall, 47% favor a ban after 15 weeks, while 53% are opposed. Among Republicans, almost three-quarters favor such a ban while among Democrats three-quarters are opposed. Independents are somewhat more opposed to a ban, 56%, with 43% in favor.
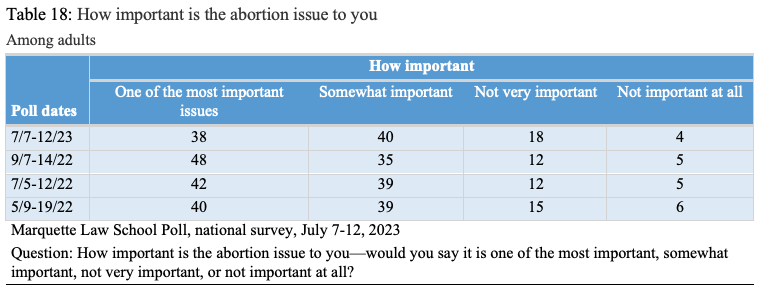
Abortion is one of the most important issues for 38% of adults, and somewhat important for 40%, with 18% saying it is not very important and 4% saying it is not important at all. There has been some decline in the percent who say it is one of the most important issues, from 48% in September 2022 to the current 38%. The full trend is shown in Table 18.
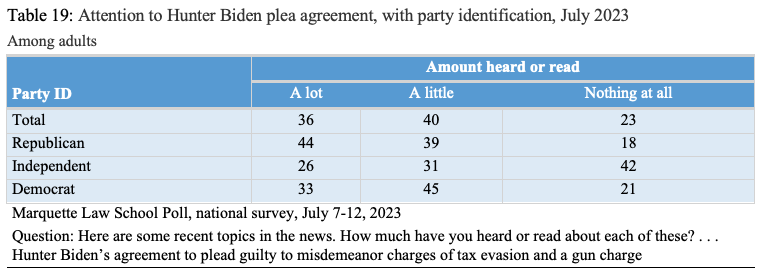
The poll asked about how much people have read or heard about a plea agreement by Hunter Biden to misdemeanor charges of tax evasion and an agreement concerning a gun charge. Among adults, 36% said they have heard or read a lot about this, 40% have heard a little, and 23% have heard nothing at all. Attention to this news also varied by party identification, as shown in Table 19, with Republicans more likely to have heard a lot than Democrats, while independents were least likely to have heard a lot.
 Presidential job approval
Approval of how Joe Biden is handling his job as president inched up slightly to 42% in July, from 39% in May. Disapproval in July was 57%, down from 61% in May. The full trend for Biden job approval in the Marquette Law School poll is shown in Table 20.
About the Marquette Law School Poll
The survey was conducted July 7-12, 2023, interviewing 1,005 adults nationwide, with a margin of error of +/-4 percentage points. For all registered voters, the margin of error is +/-4.2 percentage points. For registered voters who are Republican or independents who lean Republican, the margin of error is +/-5.8 percentage points and for registered voters who are Democrats or independents who lean Democratic the margin of error is +/-6.7 percentage points. Interviews were conducted using the SSRS Opinion Panel, a national probability sample with interviews conducted online. Certain other data from this survey (focusing on those about public views of the Supreme Court) were released yesterday, on July 26. The detailed methodology statement, survey instrument, topline results, and crosstabs for this release are available at the Marquette Law School Poll website.
About Kevin Conway

Kevin is the associate director for university communication in the Office of Marketing and Communication. Contact Kevin at (414) 288-4745 or kevin.m.conway@marquette.edu.
