New Marquette Law School national survey finds U.S. Supreme Court job approval by public continues in low 40s
Nov. 15, 2023
Please note: Complete Poll results and methodology information can be found online at law.marquette.edu/poll
MILWAUKEE – A new Marquette Law School Poll national survey finds that 41% of adults approve of the job the U.S. Supreme Court is doing, while 59% disapprove. In September, 43% approved and 57% disapproved. Approval of the Court has remained below 50% since March 2022, when it stood at 54%. While approval is up from the low point of 38% in July 2022, it has fluctuated in the low 40s percent range since then. The poll was completed before the Court released a Code of Conduct for Justices of the Supreme Court of the United States on November 13, 2023.
The trend in approval since 2020 is shown in Figure 1 and Table 1. (All results in the tables are stated as percentages; the precise wording of the questions can be found in the online link noted above.)
|
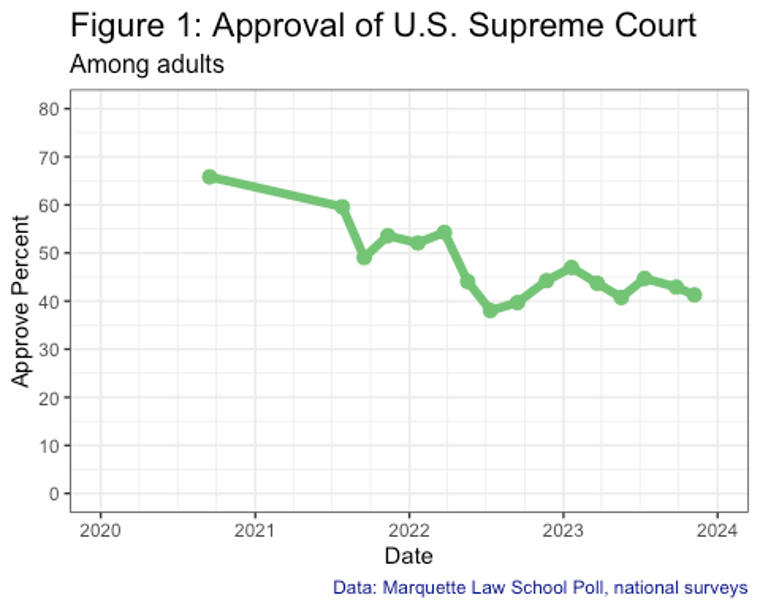
Figure 1: Supreme Court job approval
|
Table 1: Supreme Court job approval
Among adults
|
Poll dates
|
Approval
|
|
Approve
|
Disapprove
|
|
11/2-7/23
|
41
|
59
|
|
9/18-25/23
|
43
|
57
|
|
7/7-12/23
|
45
|
55
|
|
5/8-18/23
|
41
|
59
|
|
3/13-22/23
|
44
|
56
|
|
1/9-20/23
|
47
|
53
|
|
11/15-22/22
|
44
|
56
|
|
9/7-14/22
|
40
|
60
|
|
7/5-12/22
|
38
|
61
|
|
5/9-19/22
|
44
|
55
|
|
3/14-24/22
|
54
|
45
|
|
1/10-21/22
|
52
|
46
|
|
11/1-10/21
|
54
|
46
|
|
9/7-16/21
|
49
|
50
|
|
7/16-26/21
|
60
|
39
|
|
9/8-15/20
|
66
|
33
|
|
Marquette Law School Poll, national surveys
|
|
Question: Overall, how much do you approve or disapprove of the way the U.S. Supreme Court is handling its job?
|
The latest Marquette Law School Poll’s national Supreme Court survey was conducted Nov. 2-7, 2023. The survey interviewed 1,010 adults nationwide and has a margin of error of +/-4.2 percentage points.
Partisan and ideological views of the Court
Approval among Republicans of the Court’s job performance declined to 62% in November, down from 66% in September. Approval among independents also declined, standing at 23% and down from 33%, while among Democrats approval rose to 27% from 24% two months earlier. Approval by party identification of the Court’s job performance is shown in Table 2 for September and November. (Throughout this report, party identification includes independents who say they are closer to a party while “independents” separately listed here are those who say they are not closer to either party.)
Table 2: Approval of the Supreme Court’s job performance, by party identification, September and November 2023
Among adults
|
Party ID
|
Approval
|
|
Approve
|
Disapprove
|
|
Nov. 2023
|
|
Total
|
41
|
59
|
|
Republican
|
62
|
38
|
|
Independent
|
23
|
77
|
|
Democrat
|
27
|
73
|
|
Sept. 2023
|
|
Total
|
43
|
57
|
|
Republican
|
66
|
34
|
|
Independent
|
33
|
67
|
|
Democrat
|
24
|
76
|
|
Marquette Law School Poll, national surveys, Sept. 18-25, 2023 & Nov. 2-7, 2023
|
|
Question: Overall, how much do you approve or disapprove of the way the U.S. Supreme Court is handling its job?
|
|
Question: Generally speaking, do you usually think of yourself as a Republican, a Democrat, or an Independent?
|
|
Question: If independent: Do you think of yourself as closer to the Republican Party or to the Democratic Party?
|
Political ideology also structures opinion of the Court, at least as strongly as does partisanship. Table 3 shows approval in September and November by ideology.
Table 3: Approval of the Supreme Court’s job performance, by political ideology, September and November 2023
Among adults
|
Ideology
|
Approval
|
|
Approve
|
Disapprove
|
|
Nov. 2023
|
|
Total
|
41
|
59
|
|
Conservative
|
65
|
35
|
|
Moderate
|
39
|
61
|
|
Liberal
|
13
|
87
|
|
Sept. 2023
|
|
Total
|
43
|
57
|
|
Conservative
|
70
|
30
|
|
Moderate
|
37
|
63
|
|
Liberal
|
15
|
85
|
|
Marquette Law School Poll, national surveys, Sept. 18-25, 2023 & Nov. 2-7, 2023
|
|
Question: Overall, how much do you approve or disapprove of the way the U.S. Supreme Court is handling its job?
|
|
Question: Generally speaking, how would you describe your political views?
|
Abortion and gun rights
In June 2022, the Supreme Court issued the Dobbs v. Jackson Women’s Health Organization decision, which overturned the 1973 Roe v. Wade ruling that had made abortion legal in all 50 states. The Court also ruled in 2022, in New York State Rifle & Pistol Association Inc. v. Bruen, that the Second Amendment protects an individual’s right to carry a handgun for self-defense outside the home. A substantial majority, 65%, say they oppose the Dobbs decision striking down Roe, with 35% favoring the decision. On the Bruen case, 67% favor the decision, while 33% are opposed to the ruling.
Table 4 shows the trend in opinion about the Dobbs decision. There has been very little change over the past year, with close to two-thirds opposed to the decision and about one-third in favor.
Table 4: Favor or oppose Dobbs decision striking down Roe v. Wade
Among adults
|
Poll dates
|
Favor or oppose Dobbs
|
|
Favor
|
Oppose
|
|
11/2-7/23
|
35
|
65
|
|
9/18-25/23
|
36
|
64
|
|
7/7-12/23
|
38
|
62
|
|
5/8-18/23
|
35
|
65
|
|
3/13-22/23
|
33
|
67
|
|
1/9-20/23
|
35
|
64
|
|
11/15-22/22
|
33
|
66
|
|
Marquette Law School Poll, national surveys
|
|
Question: In 2022, the Supreme Court overturned Roe versus Wade, thus striking down the 1973 decision that made abortion legal in all 50 states. How much do you favor or oppose this decision?
|
Those who agree with the Court’s rulings are more approving of the Court’s job performance than those who oppose the Court’s decisions. Table 5 shows how agreement or disagreement with Dobbs is related to approval within each partisan category, which makes an impact on approval of the Court apart from the role of partisanship alone. Republicans who oppose the Dobbs decision are considerably less approving of the Court than are their fellow partisans who favor the Dobbs decision. Similarly, independents who agree with the Court’s decision are more approving of the Court than those who oppose the decision, though both of these groups strongly disapprove of the Court’s job performance. Among Democrats, the small minority who favor the Dobbs decision are far more likely to approve of the Court than are Democrats opposed to the decision.
Table 5: Court approval by opinion of Dobbs, by party identification
Among adults
|
Opinion of Dobbs
|
Court approval
|
|
Approve
|
Disapprove
|
|
Republican
|
|
Favor
|
73
|
27
|
|
Oppose
|
47
|
53
|
|
Independent
|
|
Favor
|
33
|
67
|
|
Oppose
|
19
|
81
|
|
Democrat
|
|
Favor
|
60
|
40
|
|
Oppose
|
21
|
79
|
|
Marquette Law School Poll, national survey, Nov. 2-7, 2023
|
|
Question: Overall, how much do you approve or disapprove of the way the U.S. Supreme Court is handling its job?
|
|
Question: In 2022, the Supreme Court overturned Roe versus Wade, thus striking down the 1973 decision that made abortion legal in all 50 states. How much do you favor or oppose this decision?
|
|
Question: Generally speaking, do you usually think of yourself as a Republican, a Democrat, or an Independent?
|
|
Question: If independent: Do you think of yourself as closer to the Republican Party or to the Democratic Party?
|
Support for the ruling in Bruen has been similarly stable when asked in September and November, with just under two-thirds in favor of the ruling and one-third opposed, as shown in Table 6. (A differently worded question asked in 2022 found similar support for the decision among those who had heard of the ruling.)
Table 6: Favor or oppose Bruen decision on right to bear a gun outside the home
Among adults
|
Poll dates
|
Favor or oppose Bruen
|
|
Favor
|
Oppose
|
|
11/2-7/23
|
67
|
33
|
|
9/18-25/23
|
64
|
36
|
|
Marquette Law School Poll, national surveys
|
|
Question: In 2022, the Supreme Court ruled that, subject to some restrictions, the Second Amendment protects an individual’s right to carry a handgun for self-defense outside the home. How much do you favor or oppose this decision?
|
As with Dobbs, those who agree with the decision in Bruen are more likely to approve of the Court’s job performance than are those who are opposed to the decision. This holds within each party as shown in Table 7.
Table 7: Court job performance approval by opinion of Bruen, by party identification
Among adults
|
Opinion of Bruen
|
Court approval
|
|
Approve
|
Disapprove
|
|
Republican
|
|
Favor
|
66
|
34
|
|
Oppose
|
32
|
68
|
|
Independent
|
|
Favor
|
29
|
71
|
|
Oppose
|
11
|
89
|
|
Democrat
|
|
Favor
|
35
|
65
|
|
Oppose
|
19
|
81
|
|
Marquette Law School Poll, national survey, Nov. 2-7, 2023
|
|
Question: Overall, how much do you approve or disapprove of the way the U.S. Supreme Court is handling its job?
|
|
Question: In 2022, the Supreme Court ruled that, subject to some restrictions, the Second Amendment protects an individual’s right to carry a handgun for self-defense outside the home. How much do you favor or oppose this decision?
|
|
Question: Generally speaking, do you usually think of yourself as a Republican, a Democrat, or an Independent?
|
|
Question: If independent: Do you think of yourself as closer to the Republican Party or to the Democratic Party?
|
Attention to news about the Court
As the Court began its annual term only last month, public attention to news about the Court is rather limited, as shown in Table 8. Only 15% say they have heard a lot about the Court in the last month, while 60% have heard a little and 25% have heard nothing at all. Those levels of attention are little changed since September.
Table 8: How much heard or read about U.S. Supreme Court in last month
Among adults
|
Poll dates
|
Amout heard or read
|
|
A lot
|
A little
|
Nothing at all
|
|
11/2-7/23
|
15
|
60
|
25
|
|
9/18-25/23
|
17
|
61
|
22
|
|
Marquette Law School Poll, national surveys
|
|
Question: Thinking about the last month only, how much have you heard or read about the U.S. Supreme Court?
|
Table 9 shows that Democrats are almost twice as likely as Republicans to say they’ve heard or read a lot about the Court in the past month. Independents pay an even lower amount of attention than Republicans, with almost half saying they’ve heard nothing at all about the Court in the past month.
Table 9: Amount heard about Supreme Court by party identification, Nov. 2023
Among adults
|
Party ID
|
Amount heard or read
|
|
A lot
|
A little
|
Nothing at all
|
|
Total
|
15
|
60
|
25
|
|
Republican
|
12
|
66
|
22
|
|
Independent
|
4
|
50
|
46
|
|
Democrat
|
21
|
58
|
20
|
|
Marquette Law School Poll, national survey, Nov. 2-7, 2023
|
|
Question: Thinking about the last month only, how much have you heard or read about the U.S. Supreme Court?
|
|
Question: Generally speaking, do you usually think of yourself as a Republican, a Democrat, or an Independent?
|
|
Question: If independent: Do you think of yourself as closer to the Republican Party or to the Democratic Party?
|
Recent news concerning the justices’ financial disclosures and related matters have raised attention to the ethical standards of the Court. Table 10 shows the trend since May in perception of the justices’ ethical standards.
Table 10: Honesty and ethical standards of U.S. Supreme Court justices
Among adults
|
Poll dates
|
Perceived honesty and ethical standards
|
|
Very high/high
|
Average
|
Low/Very low
|
|
11/2-7/23
|
28
|
39
|
34
|
|
9/18-25/23
|
30
|
41
|
29
|
|
7/7-12/23
|
32
|
33
|
35
|
|
5/8-18/23
|
26
|
39
|
35
|
|
Marquette Law School Poll, national surveys
|
|
Question: U.S. Supreme Court justices: Please tell me how you would rate the honesty and ethical standards of people in these different fields?
|
There are sharp partisan differences in perceptions of the Court’s ethical standards, as shown in Table 11. Republicans are nearly twice as likely as Democrats to say that the Court has high or very high ethical standards. Notably it is independents who are most likely to say the Court has low or very low standards.
Table 11: Honesty and ethical standards of U.S. Supreme Court justices, by party identification
Among adults
|
Party ID
|
Ethical standards
|
|
Very high/high
|
Average
|
Low/Very low
|
|
Total
|
28
|
39
|
34
|
|
Republican
|
39
|
40
|
21
|
|
Independent
|
17
|
38
|
46
|
|
Democrat
|
20
|
38
|
42
|
|
Marquette Law School Poll, national survey, Nov. 2-7, 2023
|
|
Question: How would you rate the honesty and ethical standards of U.S. Supreme Court justices?
|
|
Question: Generally speaking, do you usually think of yourself as a Republican, a Democrat, or an Independent?
|
|
Question: If independent: Do you think of yourself as closer to the Republican Party or to the Democratic Party?
|
While Democrats pay more attention to the Court than do Republicans or independents, those Republicans and independents who pay more attention rate the Court’s ethical standards higher than do their co-partisans who pay less attention. In contrast, Democrats who are most attentive are more likely to rate the Court’s ethical standards low or very low compared to those who pay less attention. Table 12 shows how views of ethical standards vary with attention to the Court by party.
Table 12: Court ethics by attention to Court news and by party identification
Among adults
|
Court attention
|
Ethical standards
|
|
Very high/high
|
Average
|
Low/Very low
|
|
Republican
|
|
A lot
|
44
|
38
|
18
|
|
A little
|
40
|
41
|
18
|
|
Nothing at all
|
32
|
36
|
32
|
|
Independent
|
|
A lot
|
27
|
25
|
48
|
|
A little
|
21
|
47
|
32
|
|
Nothing at all
|
12
|
28
|
60
|
|
Democrat
|
|
A lot
|
24
|
30
|
46
|
|
A little
|
19
|
40
|
42
|
|
Nothing at all
|
22
|
40
|
38
|
|
Marquette Law School Poll, national survey, Nov. 2-7, 2023
|
|
Question: How would you rate the honesty and ethical standards of U.S. Supreme Court justices?
|
|
Question: Thinking about the last month only, how much have you heard or read about the U.S. Supreme Court?
|
|
Question: Generally speaking, do you usually think of yourself as a Republican, a Democrat, or an Independent?
|
|
Question: If independent: Do you think of yourself as closer to the Republican Party or to the Democratic Party?
|
Awareness of the makeup of the Court, in terms of which party’s presidents have appointed a majority of justices, is little changed since September, with 30% saying Republican presidents definitely had appointed a majority of justices, 43% saying Republican presidents had probably done so, and 26% believing a majority had definitely or probably been appointed by Democrats. The full trend is shown in Table 13. The percentage correctly saying Republican presidents definitely appointed a majority has fluctuated modestly after a small rise following the appointment of Justice Amy Coney Barrett in the fall of 2020, which created a 6-3 majority of justices appointed by Republican presidents.
Table 13: Majority of Court appointed by which party's presidents
Among adults
|
Poll dates
|
Majority appointed by
|
|
Definitely/Probably Dem majority
|
Probably Rep majority
|
Definitely Rep majority
|
|
11/2-7/23
|
26
|
43
|
30
|
|
9/18-25/23
|
26
|
42
|
32
|
|
7/7-12/23
|
22
|
42
|
36
|
|
5/8-18/23
|
29
|
41
|
30
|
|
3/13-22/23
|
27
|
41
|
31
|
|
1/9-20/23
|
23
|
41
|
36
|
|
11/15-22/22
|
24
|
40
|
35
|
|
9/7-14/22
|
22
|
40
|
37
|
|
7/5-12/22
|
20
|
40
|
40
|
|
5/9-19/22
|
31
|
39
|
31
|
|
3/14-24/22
|
28
|
47
|
24
|
|
1/10-21/22
|
23
|
44
|
33
|
|
11/1-10/21
|
28
|
44
|
28
|
|
9/7-16/21
|
25
|
46
|
29
|
|
7/16-26/21
|
24
|
45
|
30
|
|
9/8-15/20
|
28
|
51
|
21
|
|
9/3-13/19
|
27
|
53
|
19
|
|
Marquette Law School Poll, national surveys
|
|
Question: What is your guess as to whether a majority of the current U.S. Supreme Court justices were appointed by Democratic or Republican presidents?
|
Republicans and independents are more likely to say that Democrats have appointed a majority on the Court, while Democrats are the most likely to say there is definitely a Republican-appointed majority on the Court, as shown in Table 14.
Table 14: Majority of U.S. Supreme Court justices appointed by which party, by party identification
Among adults
|
Party ID
|
Majority appointed by which party
|
|
Definitely/Probably Dem majority
|
Probably Rep majority
|
Definitely Rep majority
|
|
Total
|
26
|
43
|
30
|
|
Republican
|
32
|
39
|
29
|
|
Independent
|
37
|
45
|
18
|
|
Democrat
|
17
|
47
|
35
|
|
Marquette Law School Poll, national survey, Nov. 2-7, 2023
|
|
Question: What is your guess as to whether a majority of the current U.S. Supreme Court justices were appointed by Democratic or Republican presidents?
|
|
Question: Generally speaking, do you usually think of yourself as a Republican, a Democrat, or an Independent?
|
|
Question: If independent: Do you think of yourself as closer to the Republican Party or to the Democratic Party?
|
Confidence in institutions
Confidence in several institutions is summarized in Table 15. Juries in criminal cases draw the highest public confidence of the six institutions surveyed and the lowest percentage of respondents saying they have little or no confidence. “Your state Supreme court” has the next highest confidence ratings. The U.S. Supreme Court and U.S. Department of Justice have very similar ratings, followed by the presidency and Congress.
Table 15: Confidence in institutions
Among adults
|
Institution
|
Confidence
|
|
Great deal/a lot
|
Some
|
Little/None
|
|
Juries that decide criminal cases
|
36
|
42
|
22
|
|
Your state Supreme court
|
30
|
40
|
30
|
|
U.S. Supreme Court
|
28
|
36
|
36
|
|
The U.S. Department of Justice
|
27
|
38
|
35
|
|
The presidency
|
26
|
32
|
42
|
|
Congress
|
10
|
37
|
53
|
|
Marquette Law School Poll, national survey, Nov. 2-7, 2023
|
|
Question: Here is a list of institutions in American society. How much confidence do you have in each one?
|
Confidence in the Court as an institution remained stable from September to November, with 28% expressing a great deal or a lot of confidence, 36% some confidence, and 36% saying they have little or no confidence in the Court. The full trend is shown in Table 16.
Table 16: Confidence in the U.S. Supreme Court
Among adults
|
Poll dates
|
Confidence
|
|
Great deal/a lot
|
Some
|
Little/None
|
|
11/2-7/23
|
28
|
36
|
36
|
|
9/18-25/23
|
28
|
37
|
35
|
|
7/7-12/23
|
31
|
32
|
37
|
|
5/8-18/23
|
25
|
36
|
39
|
|
3/13-22/23
|
28
|
40
|
32
|
|
1/9-20/23
|
31
|
38
|
31
|
|
11/15-22/22
|
30
|
36
|
34
|
|
9/7-14/22
|
30
|
34
|
36
|
|
7/5-12/22
|
28
|
28
|
44
|
|
9/8-15/20
|
39
|
45
|
16
|
|
9/3-13/19
|
37
|
42
|
20
|
|
Marquette Law School Poll, national surveys
|
|
Question: Here is a list of institutions in American society. How much confidence do you have in each one? … The U.S. Supreme Court
|
As with approval of job performance, Republicans have more confidence in the Supreme Court than do Democrats, while independents are especially low in confidence, as shown in Table 17.
Table 17: Confidence in the U.S. Supreme Court, by party identification
Among adults
|
Party ID
|
Confidence
|
|
Great deal/a lot
|
Some
|
Little/None
|
|
Total
|
28
|
36
|
36
|
|
Republican
|
37
|
38
|
25
|
|
Independent
|
17
|
35
|
49
|
|
Democrat
|
23
|
34
|
44
|
|
Marquette Law School Poll, national survey, Nov. 2-7, 2023
|
|
Question: Here is a list of institutions in American society. How much confidence do you have in each one? ... The U.S. Supreme Court
|
|
Question: Generally speaking, do you usually think of yourself as a Republican, a Democrat, or an Independent?
|
|
Question: If independent: Do you think of yourself as closer to the Republican Party or to the Democratic Party?
|
A general lack of trust in the federal government contributes to low confidence in the Court specifically. Table 18 shows how confidence in the Court declines as trust declines.
Table 18: Confidence in the U.S. Supreme Court by general trust in federal government
Among adults
|
Trust in government
|
Confidence
|
|
Great deal/a lot
|
Some
|
Little/None
|
|
Total
|
28
|
36
|
36
|
|
Always/Most of the time
|
47
|
34
|
20
|
|
Only some of the time
|
26
|
41
|
34
|
|
Never
|
17
|
21
|
63
|
|
Marquette Law School Poll, national survey, Nov. 2-7, 2023
|
|
Question: Here is a list of institutions in American society. How much confidence do you have in each one? ... The U.S. Supreme Court
|
|
Question: How much of the time do you think you can trust the government in Washington to do what is right?
|
|
Question: If independent: Do you think of yourself as closer to the Republican Party or to the Democratic Party?
|
Trust in government has strong effects within each party, as shown in Table 19. Confidence in the court declines as trust declines among Republicans, independents, and Democrats alike. Republicans have more confidence in the Court than do Democrats with the same levels of trust in government, with independents falling in between the partisans at each level of trust. This table combines the Marquette Law School Poll’s national surveys from July, September, and November in order to provide enough cases in each of the subgroups for analysis.
Table 19: Confidence in the U.S. Supreme Court by trust in government and by party identification
Among adults, combined July, September, and November Marquette national polls
|
Trust in government
|
Confidence
|
|
Great deal/a lot
|
Some
|
Little/None
|
|
Republican
|
|
Always/Most of the time
|
57
|
32
|
12
|
|
Only some of the time
|
46
|
39
|
15
|
|
Never
|
29
|
33
|
37
|
|
Independent
|
|
Always/Most of the time
|
47
|
41
|
12
|
|
Only some of the time
|
15
|
47
|
38
|
|
Never
|
8
|
14
|
79
|
|
Democrat
|
|
Always/Most of the time
|
36
|
31
|
34
|
|
Only some of the time
|
14
|
35
|
51
|
|
Never
|
5
|
15
|
80
|
|
Marquette Law School Poll, national surveys, July, September and November 20233
|
|
Question: Here is a list of institutions in American society. How much confidence do you have in each one? ... The U.S. Supreme Court
|
|
Question: How much of the time do you think you can trust the government in Washington to do what is right?
|
|
Question: Generally speaking, do you usually think of yourself as a Republican, a Democrat, or an Independent?
|
|
Question: If independent: Do you think of yourself as closer to the Republican Party or to the Democratic Party?
|
While confidence in juries that decide criminal cases has the highest level of the six institutions rated in this survey, the levels of confidence decreased slightly from September when 40% had a great deal or a lot of confidence, 41% some confidence, and 19% had little or no confidence.
Confidence in juries declined among Republicans and independents from September to November, while it held steady among Democrats, as shown in Table 20.
Table 20: Confidence in juries in criminal cases, by party identification
Among adults
|
Party ID
|
Confidence
|
|
Great deal/a lot
|
Some
|
Little/None
|
|
Republican
|
|
11/2-7/23
|
28
|
46
|
26
|
|
9/18-25/23
|
37
|
44
|
19
|
|
Independent
|
|
11/2-7/23
|
27
|
39
|
34
|
|
9/18-25/23
|
30
|
47
|
23
|
|
Democrat
|
|
11/2-7/23
|
46
|
39
|
15
|
|
9/18-25/23
|
46
|
36
|
18
|
|
Marquette Law School Poll, national surveys, Sept. 18-25, 2023 & Nov. 2-7, 2023
|
|
Question: Here is a list of institutions in American society. How much confidence do you have in each one? ... Juries that decide guilt or innocence in criminal cases
|
|
Question: Generally speaking, do you usually think of yourself as a Republican, a Democrat, or an Independent?
|
|
Question: If independent: Do you think of yourself as closer to the Republican Party or to the Democratic Party?
|
The Department of Justice (DOJ) has become the subject of partisan debate over its handling of a number of prosecutions and investigations in recent years. Overall, 27% say they have a great deal or a lot of confidence in the DOJ, while 38% say they have some confidence and a substantial 35% say they have little or no confidence. In September, 30% had a great deal or a lot of confidence in the DOJ, 35% had some, and 35% had little or no confidence.
Partisan differences and the trends since July are shown in Table 21. Republicans and independents have substantially less confidence in the DOJ than do Democrats.
Table 21: Confidence in U.S. Department of Justice, by party identification
Among adults
|
Party ID
|
Confidence
|
|
Great deal/a lot
|
Some
|
Little/None
|
|
Republican
|
|
11/2-7/23
|
14
|
38
|
47
|
|
9/18-25/23
|
17
|
33
|
51
|
|
7/7-12/23
|
13
|
28
|
58
|
|
Independent
|
|
11/2-7/23
|
14
|
37
|
50
|
|
9/18-25/23
|
19
|
52
|
29
|
|
7/7-12/23
|
18
|
33
|
49
|
|
Democrat
|
|
11/2-7/23
|
43
|
38
|
19
|
|
9/18-25/23
|
45
|
32
|
23
|
|
7/7-12/23
|
40
|
41
|
20
|
|
Marquette Law School Poll, national surveys, July, September, November 2023
|
|
Question: Here is a list of institutions in American society. How much confidence do you have in each one? ... The U.S. Department of Justice
|
|
Question: Generally speaking, do you usually think of yourself as a Republican, a Democrat, or an Independent?
|
|
Question: If independent: Do you think of yourself as closer to the Republican Party or to the Democratic Party?
|
In November, 30% said they had a great deal or a lot of confidence in their state Supreme Court, 40% had some confidence, and 30% had little or no confidence. State courts draw modestly greater confidence from the survey respondents than does the U.S. Supreme Court.
Unlike the U.S. Supreme Court, there is little partisan divide in confidence in state Supreme Courts in the aggregate. Republicans and Democrats have very similar levels of confidence in their state Supreme Courts, though independents are much less confident than either partisan group, as shown in Table 22.
Table 22: Confidence in state Supreme Court, by party identification
Among adults
|
Party ID
|
Confidence
|
|
Great deal/a lot
|
Some
|
Little/None
|
|
Total
|
30
|
40
|
30
|
|
Republican
|
31
|
41
|
27
|
|
Independent
|
12
|
38
|
50
|
|
Democrat
|
34
|
40
|
26
|
|
Marquette Law School Poll, national surveys, Nov. 2-7, 2023
|
|
Question: Here is a list of institutions in American society. How much confidence do you have in each one? … Your state Supreme Court or highest court in your state
|
|
Question: Generally speaking, do you usually think of yourself as a Republican, a Democrat, or an Independent?
|
|
Question: If independent: Do you think of yourself as closer to the Republican Party or to the Democratic Party?
|
Perceived ideology of the U.S. Supreme Court
Public perception of the ideology of the U.S. Supreme Court has shifted in a conservative direction since 2019, as shown in Table 23. In September 2019, 38% of the public saw the Court as very or somewhat conservative. In the current poll, 56% see the Court that way. Over this same period, the percent saying the Court is moderate has declined from 50% to 32%. Few people—12%—see the Court as liberal or very liberal.
Table 23: Perceived ideology of the U.S. Supreme Court
Among adults
|
Poll dates
|
Perceived ideology
|
|
Very conservative
|
Somewhat conservative
|
Moderate
|
Somewhat liberal
|
Very liberal
|
|
11/2-7/23
|
21
|
35
|
32
|
7
|
5
|
|
9/18-25/23
|
20
|
37
|
32
|
7
|
3
|
|
7/7-12/23
|
27
|
35
|
28
|
7
|
3
|
|
5/8-18/23
|
24
|
33
|
30
|
10
|
3
|
|
3/13-22/23
|
23
|
35
|
34
|
6
|
2
|
|
1/9-20/23
|
22
|
37
|
31
|
8
|
2
|
|
11/15-22/22
|
25
|
36
|
32
|
6
|
2
|
|
9/7-14/22
|
29
|
35
|
27
|
5
|
3
|
|
7/5-12/22
|
34
|
33
|
21
|
7
|
3
|
|
5/9-19/22
|
23
|
33
|
34
|
8
|
2
|
|
3/14-24/22
|
15
|
37
|
36
|
10
|
2
|
|
1/10-21/22
|
17
|
38
|
35
|
8
|
2
|
|
11/1-10/21
|
15
|
35
|
39
|
8
|
1
|
|
9/7-16/21
|
16
|
35
|
40
|
7
|
2
|
|
7/16-26/21
|
13
|
37
|
42
|
6
|
1
|
|
9/8-15/20
|
5
|
30
|
54
|
9
|
2
|
|
9/3-13/19
|
5
|
33
|
50
|
9
|
3
|
|
Marquette Law School Poll, national surveys
|
|
Question: In general, would you describe each of the following as…?... The U.S. Supreme Court.
|
Since 2019, there has been an increase in the percentage of the public who think the justices’ decisions are motivated by politics, rising from 35% in 2019 to 55% in the current poll. There has been a sharp increase beginning in January 2022 when there was a 17-percentage-point jump from the survey prior. The full trend is shown in Table 24.
Table 24: Are justices' decisions motivated mainly by the law or mainly by politics
Among adults
|
Poll dates
|
Perceived motivation
|
|
Mainly politics
|
Mainly the law
|
|
11/2-7/23
|
55
|
45
|
|
9/18-25/23
|
52
|
48
|
|
7/7-12/23
|
58
|
42
|
|
1/9-20/23
|
49
|
51
|
|
7/5-12/22
|
52
|
48
|
|
1/10-21/22
|
47
|
53
|
|
11/1-10/21
|
30
|
70
|
|
9/7-16/21
|
39
|
61
|
|
7/16-26/21
|
29
|
71
|
|
9/8-15/20
|
37
|
62
|
|
9/3-13/19
|
35
|
64
|
|
Marquette Law School Poll, national surveys
|
|
Question: In general, what most often motivates Supreme Court justices’ decisions?
|
Ideological views also structure reaction to individual decisions of the Court. Some decisions are more popular with all respondents, and some less popular, but reaction follows ideological lines for each of five major decisions of recent years.
Table 25 shows overall reaction to each decision. Four of the five decisions have a majority in favor while the decision overturning Roe v. Wade has a majority opposed.
Table 25: Favor or oppose recent major Court decisions
Among adults
|
Decision
|
Favor or oppose
|
|
Favor
|
Oppose
|
|
Same-sex marriage
|
65
|
35
|
|
LGBT anti-discrimination protection
|
82
|
18
|
|
Overturn Roe v. Wade
|
35
|
65
|
|
Guns outside home
|
67
|
33
|
|
Ban use of race in college admissions
|
79
|
21
|
|
Marquette Law School Poll, national survey, Nov. 2-7, 2023
|
|
Question: In 2015, the Supreme Court ruled that the Constitution guarantees a right to same-sex marriage. How much do you favor or oppose this decision?
|
|
Question: In 2020, the Supreme Court ruled that a federal civil rights law protects gay and transgender workers from workplace discrimination. How much do you favor or oppose this decision?
|
|
Question: In 2022, the Supreme Court overturned Roe v. Wade, thus striking down the 1973 decision that made abortion legal in all 50 states. How much do you favor or oppose this decision?
|
|
Question: In 2022, the Supreme Court ruled that, subject to some restrictions, the Second Amendment protects an individual’s right to carry a handgun for self-defense outside the home. How much do you favor or oppose this decision?
|
|
Question: In 2023, the Supreme Court ruled that colleges cannot use race as a factor in deciding which applicants to admit. How much do you favor or oppose this decision?
|
Table 26 shows the percentage favoring each of those decisions by respondent ideology. Liberals are more in favor of two conventionally liberal decisions, on same-sex marriage and anti-discrimination protection for LGBT workers, while conservatives are less so. Conservatives are more in favor for conventionally conservative decisions on abortion, guns outside the home, and banning the use of race in college admissions, while liberals are less so.
Table 26: Favor recent Court decisions, by ideology
Adults
|
Ideology
|
Percentage favoring decision
|
|
Same-sex marriage
|
LGBT anti-discrimination protection
|
Overturn Roe v. Wade
|
Guns outside home
|
Ban use of race in admissions
|
|
Conservative
|
43
|
72
|
64
|
87
|
93
|
|
Moderate
|
68
|
85
|
24
|
67
|
82
|
|
Liberal
|
89
|
90
|
10
|
42
|
58
|
|
Marquette Law School Poll, national survey, Nov. 2-7, 2023
|
|
Question: Generally speaking, how would you describe your political views?
|
Like ideology, partisanship structures reaction to decisions, as shown in Table 27.
Table 27: Favor recent Court decisions, by party identification
Adults
|
Party ID
|
Percentage favoring decision
|
|
Same-sex marriage
|
LGBT anti-discrimination protection
|
Overturn Roe v. Wade
|
Guns outside home
|
Ban use of race in admissions
|
|
Republican
|
49
|
72
|
57
|
88
|
92
|
|
Independent
|
64
|
75
|
25
|
65
|
79
|
|
Democrat
|
82
|
94
|
15
|
48
|
67
|
|
Marquette Law School Poll, national survey, Nov. 2-7, 2023
|
|
Question: Generally speaking, do you usually think of yourself as a Republican, a Democrat, or an Independent?
|
|
Question: If independent: Do you think of yourself as closer to the Republican Party or to the Democratic Party?
|
About the Marquette Law School Poll
The survey was conducted Nov. 2-7, 2023, interviewing 1,010 adults nationwide, with a margin of error of +/-4.2 percentage points. Interviews were conducted using the SSRS Opinion Panel, a national probability sample with interviews conducted online. The detailed methodology statement, survey instrument, topline results, and crosstabs for this release are available at the Marquette Law School Poll website. Some items from this survey are held for later release.
Wording of questions about past Supreme Court decisions: These items do not attempt to exactly frame the particular issues in specific cases but rather address the topic in more general terms.
The wording of questions about previous decisions include:
Opinion of same-sex marriage decision:
- In 2015, the Supreme Court ruled that the Constitution guarantees a right to same-sex marriage. How much do you favor or oppose this decision?
Opinion of decision on anti-discrimination law protecting gay and transgender employees
- In 2020, the Supreme Court ruled that a federal civil rights law protects gay and transgender workers from workplace discrimination. How much do you favor or oppose this decision?
Opinion of Dobbs decision, striking down Roe v. Wade
- In 2022, the Supreme Court overturned Roe v. Wade, thus striking down the 1973 decision that made abortion legal in all 50 states. How much do you favor or oppose this decision?
Opinion of decision concerning possession of guns outside the home
- In 2022, the Supreme Court ruled that, subject to some restrictions, the Second Amendment protects an individual’s right to carry a handgun for self-defense outside the home. How much do you favor or oppose this decision?
Opinion of decision banning use of race in college admissions
In 2023, the Supreme Court ruled that colleges cannot use race as a factor in deciding which applicants to admit. How much do you favor or oppose this decision?
About Kevin Conway

Kevin is the associate director for university communication in the Office of Marketing and Communication. Contact Kevin at (414) 288-4745 or kevin.m.conway@marquette.edu.
