New Marquette Law School national survey finds approval of U.S. Supreme Court at 40%, public split on removal of Trump from ballot
Confidence in juries remains high compared to other institutions; public remains opposed to the overturning of Roe v. Wade, supportive of gun rights outside home
Feb. 21, 2024
Please note: Complete Poll results and methodology information can be found online at law.marquette.edu/poll
MILWAUKEE – A new Marquette Law School Poll national survey finds that 40% of adults approve of the job that the Supreme Court of the United States is doing, while 60% disapprove. In November, 41% approved and 59% disapproved. Approval of the Court has remained below 50% in surveys since March 2022, when it stood at 54%. While approval is up from the low point of 38% in July 2022, it has declined from its recent high of 45% in July 2023.
The trend in approval since 2020 is shown in Figure 1 and Table 1. (All results in the tables are stated as percentages; the precise wording of the questions can be found in the online link noted above.)
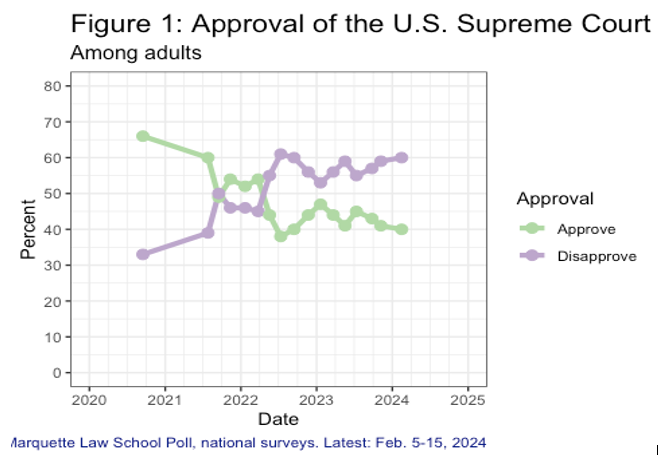
Table 1: U.S. Supreme Court approval
Among adults
|
Poll dates
|
Approval
|
|
Approve
|
Disapprove
|
|
2/5-15/24
|
40
|
60
|
|
11/2-7/23
|
41
|
59
|
|
9/18-25/23
|
43
|
57
|
|
7/7-12/23
|
45
|
55
|
|
5/8-18/23
|
41
|
59
|
|
3/13-22/23
|
44
|
56
|
|
1/9-20/23
|
47
|
53
|
|
11/15-22/22
|
44
|
56
|
|
9/7-14/22
|
40
|
60
|
|
7/5-12/22
|
38
|
61
|
|
5/9-19/22
|
44
|
55
|
|
3/14-24/22
|
54
|
45
|
|
1/10-21/22
|
52
|
46
|
|
11/1-10/21
|
54
|
46
|
|
9/7-16/21
|
49
|
50
|
|
7/16-26/21
|
60
|
39
|
|
9/8-15/20
|
66
|
33
|
|
Marquette Law School Poll, national surveys, latest Feb. 5-15, 2024
|
|
Question: Overall, how much do you approve or disapprove of the way the U.S. Supreme Court is handling its job?
|
The latest Marquette Law School Poll’s national Supreme Court survey was conducted Feb. 5-15, 2024. The survey interviewed 1,003 adults nationwide and has a margin of error of +/-4.3 percentage points.
Partisan and ideological views of the Court
Views of the Court have come to be substantially structured by partisanship, more so in recent years. In 2020, the first year the Marquette Law School Poll asked this question about the Court, national majorities of Republicans, independents, and Democrats approved of the job the Court was doing, as shown in Table 2, with Republican approval being especially high. In the current survey, there are substantially larger partisan differences, with a majority of Republicans approving of the Court’s job performance, while majorities of independents and Democrats disapprove, as shown in Table 3. (Throughout this report, party identification includes independents who say that they are closer to a party, while independents are those who say they are not closer to either party.)
Table 2: U.S. Supreme Court approval, by party identification, 2020
Among adults
|
Party ID
|
Approval
|
|
Approve
|
Disapprove
|
|
Total
|
66
|
33
|
|
Republican
|
78
|
20
|
|
Independent
|
50
|
46
|
|
Democrat
|
60
|
39
|
|
Marquette Law School Poll, national survey, Sept. 8-15, 2020
|
|
Question: Overall, how much do you approve or disapprove of the way the U.S. Supreme Court is handling its job?
|
Table 3: U.S. Supreme Court approval, by party identification, 2024
Among adults
|
Party ID
|
Approval
|
|
Approve
|
Disapprove
|
|
Total
|
40
|
60
|
|
Republican
|
57
|
43
|
|
Independent
|
28
|
72
|
|
Democrat
|
27
|
73
|
|
Marquette Law School Poll, national survey, Feb. 5-15, 2024
|
|
Question: Overall, how much do you approve or disapprove of the way the U.S. Supreme Court is handling its job?
|
Political ideological identification also shapes views of the Court, as shown in Table 4. Self-described conservatives are strongly approving of the Court, while self-described liberals are sharply disapproving. A majority of moderates also disapprove.
Table 4: U.S. Supreme Court approval, by self-described ideology, 2024
Among adults
|
Ideology
|
Approval
|
|
Approve
|
Disapprove
|
|
Total
|
40
|
60
|
|
Very conservative
|
62
|
38
|
|
Somewhat conservative
|
54
|
46
|
|
Moderate
|
37
|
63
|
|
Somewhat liberal
|
25
|
75
|
|
Very liberal
|
17
|
83
|
|
Marquette Law School Poll, national survey, Feb. 5-15, 2024
|
|
Question: Overall, how much do you approve or disapprove of the way the U.S. Supreme Court is handling its job?
|
|
Question: Generally speaking, how would you describe your political views?
|
Public opinion about pending cases
Substantial percentages of respondents say they haven’t heard enough to have an opinion about a case concerning Colorado’s decision to remove former President Donald Trump from the ballot under the U.S. Constitution’s 14th Amendment, or about a case concerning the possession of firearms by people under domestic violence restraining orders. On the former, 31% say they haven’t heard anything or haven’t heard enough to have an opinion, while on the gun possession case 42% haven’t heard anything or haven’t heard enough.
Of those with an opinion, 50% favor the U.S. Supreme Court’s overturning the Colorado decision to disqualify Trump from the ballot, while 50% oppose overturning that decision.
Of those with an opinion, 91% say the Court should uphold a federal law that prohibits people under domestic violence restraining orders from possessing firearms, while 9% think that the Court should hold it unconstitutional.
Attention to news about the Court
Attention among the public to news about the Supreme Court has increased since November but remains rather limited. Table 5 shows the trend in attention to news about the Court from September 2023 to February 2024. In both September and November, few respondents had heard a lot about the Court in the previous month, but in February attention rose as the Court heard arguments in some major cases. Almost a quarter have heard a lot about the Court in the last month, while about one in five say they’ve heard no news about the Court in that time. A majority say they have heard just a little.
Table 5: Attention to news about the Court
Among adults
|
Poll dates
|
How much heard or read
|
|
A lot
|
A little
|
Nothing at all
|
|
2/5-15/24
|
24
|
56
|
20
|
|
11/2-7/23
|
15
|
60
|
25
|
|
9/18-25/23
|
17
|
61
|
22
|
|
Marquette Law School Poll, national surveys, latest Feb. 5-15, 2024
|
|
Question: Thinking about the last month only, how much have you heard or read about the U.S. Supreme Court?
|
Past decisions
Opinions about recent decisions concerning abortion, gun possession outside the home, and the use of race in college admissions have remained stable in recent months.
In June 2022, the Supreme Court issued the Dobbs v. Jackson Women’s Health Organization decision, overturning the 1973 Roe v. Wade ruling that made abortion legal in all 50 states. The Court also ruled then in New York State Rifle & Pistol Association Inc. v. Bruen that the Second Amendment protects an individual’s right to carry a handgun for self-defense outside the home. A year later, in June 2023, the Court ruled in Students for Fair Admissions, Inc. v. President and Fellows of Harvard College that use of race in university admissions violates the equal protection clause of the 14th Amendment.
Table 6 shows the trend in opinion about the Dobbs decision. A substantial majority, 67%, oppose the decision, while 33% favor it. In polling from November 2022 to February 2024, these percentages have fluctuated by only a few percentage points, with no consistent trend.
Table 6: Favor or oppose Dobbs decision striking down Roe v. Wade
Among adults
|
Poll dates
|
Favor or oppose *Dobbs*
|
|
Favor
|
Oppose
|
|
2/5-15/24
|
33
|
67
|
|
11/2-7/23
|
35
|
65
|
|
9/18-25/23
|
36
|
64
|
|
7/7-12/23
|
38
|
62
|
|
5/8-18/23
|
35
|
65
|
|
3/13-22/23
|
33
|
67
|
|
1/9-20/23
|
35
|
64
|
|
11/15-22/22
|
33
|
66
|
|
Marquette Law School Poll, national surveys, latest Feb. 5-15, 2024
|
|
Question: In 2022, the Supreme Court overturned Roe versus Wade, thus striking down the 1973 decision that made abortion legal in all 50 states. How much do you favor or oppose this decision?
|
Opinion of the Bruen decision is shown in Table 7. A solid majority, 64%, favor Bruen’s affirmation of a right to possess a firearm outside the home, while 36% are opposed to the decision. There has been little change in these views in polls from September 2023 to the present.
Table 7: Favor or oppose Bruen decision on gun rights
Among adults
|
Poll dates
|
Favor or oppose *Bruen*
|
|
Favor
|
Oppose
|
|
2/5-15/24
|
64
|
36
|
|
11/2-7/23
|
67
|
33
|
|
9/18-25/23
|
64
|
36
|
|
Marquette Law School Poll, national surveys, latest Feb. 5-15, 2024
|
|
Question: In 2022, the Supreme Court ruled that, subject to some restrictions, the Second Amendment protects an individual’s right to carry a handgun for self-defense outside the home. How much do you favor or oppose this decision?
|
Regarding the 2023 Students for Fair Admissions case, in the current poll, 75% favor the decision banning the use of race in admissions, while 25% oppose that ruling. Table 8 shows that the majority opinion among the public has remained stable since September 2023.
Table 8: Favor or oppose Students for Fair Admissions decision on race in college admissions
Among adults
|
Poll dates
|
Favor or oppose decision
|
|
Favor
|
Oppose
|
|
2/5-15/24
|
75
|
25
|
|
11/2-7/23
|
79
|
21
|
|
9/18-25/23
|
77
|
23
|
|
Marquette Law School Poll, national surveys, latest Feb. 5-15, 2024
|
|
Question: In 2023, the Supreme Court ruled that colleges cannot use race as a factor in deciding which applicants to admit. How much do you favor or oppose this decision?
|
|
|
Confidence in institutions
Confidence in several institutions is summarized in Table 9. Juries in criminal cases enjoy the highest confidence of the five institutions, with the lowest percentage saying they have little or no confidence in juries. The U.S. Department of Justice, the U.S. Supreme Court, and the presidency each have the same percentage, 25%, saying they have a great deal or a lot of confidence, with small differences in those saying little or no confidence. Congress has the lowest confidence rating, with 10% of the public expressing a great deal or a lot of confidence and 57% saying they have little or no confidence in Congress. That is a decline: In July 2023, 14% said they had a great deal or a lot of confidence in Congress, while 43% had little or no confidence.
Table 9: Confidence in institutions
Among adults
|
Institution
|
Confidence
|
|
Great deal/a lot
|
Some
|
Little/None
|
|
Juries that decide criminal cases
|
34
|
42
|
24
|
|
The U.S. Department of Justice
|
25
|
36
|
38
|
|
U.S. Supreme Court
|
25
|
35
|
40
|
|
The presidency
|
25
|
31
|
44
|
|
Congress
|
10
|
33
|
57
|
|
Marquette Law School Poll, national survey, Feb. 5-15, 2024
|
|
Question: Here is a list of institutions in American society. How much confidence do you have in each one?
|
Confidence in the Court as an institution has declined from its recent high in July 2023, when 31% expressed a great deal or a lot of confidence, 32% some confidence, and 37% little or no confidence in the Court. The full trend is shown in Table 10.
Table 10: Confidence in the U.S. Supreme Court
Among adults
|
Poll dates
|
Confidence
|
|
Great deal/a lot
|
Some
|
Little/None
|
|
2/5-15/24
|
25
|
35
|
40
|
|
11/2-7/23
|
28
|
36
|
36
|
|
9/18-25/23
|
28
|
37
|
35
|
|
7/7-12/23
|
31
|
32
|
37
|
|
5/8-18/23
|
25
|
36
|
39
|
|
3/13-22/23
|
28
|
40
|
32
|
|
1/9-20/23
|
31
|
38
|
31
|
|
11/15-22/22
|
30
|
36
|
34
|
|
9/7-14/22
|
30
|
34
|
36
|
|
7/5-12/22
|
28
|
28
|
44
|
|
9/8-15/20
|
39
|
45
|
16
|
|
9/3-13/19
|
37
|
42
|
20
|
|
Marquette Law School Poll, national surveys, latest Feb. 5-15, 2024
|
|
Question: The U.S. Supreme Court: Here is a list of institutions in American society. How much confidence do you have in each one?
|
Since 2019, there has been an increase in the percentage of the public who think the justices’ decisions are motivated by politics, rising from 35% in 2019 to 54% in the current poll, with a sharp increase beginning in January 2022. The full trend is shown in Table 11.
Table 11: Are justices' decisions motivated mainly by the law or mainly by politics?
Among adults
|
Poll dates
|
Perceived motivation
|
|
Mainly politics
|
Mainly the law
|
|
2/5-15/24
|
54
|
46
|
|
11/2-7/23
|
55
|
45
|
|
9/18-25/23
|
52
|
48
|
|
7/7-12/23
|
58
|
42
|
|
1/9-20/23
|
49
|
51
|
|
7/5-12/22
|
52
|
48
|
|
1/10-21/22
|
47
|
53
|
|
11/1-10/21
|
30
|
70
|
|
9/7-16/21
|
39
|
61
|
|
7/16-26/21
|
29
|
71
|
|
9/8-15/20
|
37
|
62
|
|
9/3-13/19
|
35
|
64
|
|
Marquette Law School Poll, national surveys, latest Feb. 5-15, 2024
|
|
Question: In general, what most often motivates Supreme Court justices’ decisions?
|
There has been a small fluctuation in the ratings of the honesty and ethical standards of the justices of the Supreme Court from May 2023 to the present. In the current poll, 27% rate the standards of the justices as very high or high, 36% rate them as low or very low, and 37% call them average. In July 2023, 32% rated the justices’ ethical standards very high or high, while 35% rated them low or very low, while in May 2023 the numbers were very close to the current ones. The full trend is shown in Table 12.
Table 12: Honesty and ethical standards of justices
Among adults
|
Poll dates
|
Honesty & ethical standards
|
|
Very high/high
|
Average
|
Low/Very low
|
|
2/5-15/24
|
27
|
37
|
36
|
|
11/2-7/23
|
28
|
39
|
34
|
|
9/18-25/23
|
30
|
41
|
29
|
|
7/7-12/23
|
32
|
33
|
35
|
|
5/8-18/23
|
26
|
39
|
35
|
|
Marquette Law School Poll, national surveys, latest Feb. 5-15, 2024
|
|
Question: How would you rate the honesty and ethical standards of U.S. Supreme Court justices?
|
Views of the justices
Despite their position on the high court, Supreme Court justices are not well known to the public. While perceptions of the individual justices vary, more than half of the public lacks an opinion of each of the justices other than Justice Clarence Thomas and Justice Brett Kavanaugh. The favorability ratings of the justices are shown in Table 13.
Table 13: Favorability ratings of U.S. Supreme Court justices
Among adults
|
|
Favorability
|
|
Candidate
|
Net favorable
|
Favorable
|
Unfavorable
|
Not heard/not enough
|
|
Alito
|
0
|
16
|
16
|
67
|
|
Barrett
|
-5
|
19
|
24
|
57
|
|
Gorsuch
|
1
|
15
|
14
|
70
|
|
Jackson
|
7
|
23
|
16
|
61
|
|
Kagan
|
6
|
15
|
9
|
76
|
|
Kavanaugh
|
-7
|
23
|
30
|
47
|
|
Roberts
|
11
|
25
|
14
|
60
|
|
Sotomayor
|
15
|
31
|
16
|
53
|
|
Thomas
|
-7
|
26
|
33
|
41
|
|
Marquette Law School Poll, national survey, Feb. 5-15, 2024
|
|
Question: Some justices of the Supreme Court are better known than others. For each of these names, have you never heard of them, heard of them but don’t know enough to have an opinion of them, have a favorable opinion or have an unfavorable opinion?
|
About the Marquette Law School Poll
The survey was conducted Feb. 5-15, 2024, interviewing 1,003 adults nationwide, with a margin of error of +/-4.3 percentage points. Interviews were conducted using the SSRS Opinion Panel, a national probability sample with interviews conducted online. The detailed methodology statement, survey instrument, topline results, and crosstabs for this release are available on the Marquette Law Poll website. Some items from this survey are held for later release.
Wording of questions about past Supreme Court decisions: These items do not attempt to exactly frame the particular issues in specific cases but rather address the topic in more general terms.
The wording of questions about previous decisions include:
Opinion of Dobbs decision, striking down Roe v. Wade
- In 2022 the Supreme Court overturned Roe versus Wade, thus striking down the 1973 decision that made abortion legal in all 50 states. How much do you favor or oppose this decision?
Opinion of decision concerning possession of guns outside the home
- In 2022, the Supreme Court ruled that, subject to some restrictions, the Second Amendment protects an individual’s right to carry a handgun for self-defense outside the home. How much do you favor or oppose this decision?
Opinion of decision banning use of race in college admissions
In 2023, the Supreme Court ruled that colleges cannot use race as a factor in deciding which applicants to admit. How much do you favor or oppose this decision?
About Kevin Conway

Kevin is the associate director for university communication in the Office of Marketing and Communication. Contact Kevin at (414) 288-4745 or kevin.m.conway@marquette.edu.
