


Quick Links
- Search the Catalog
- Data Warehouse Overview
- dataMarq FAQ
- Catalog User Guide
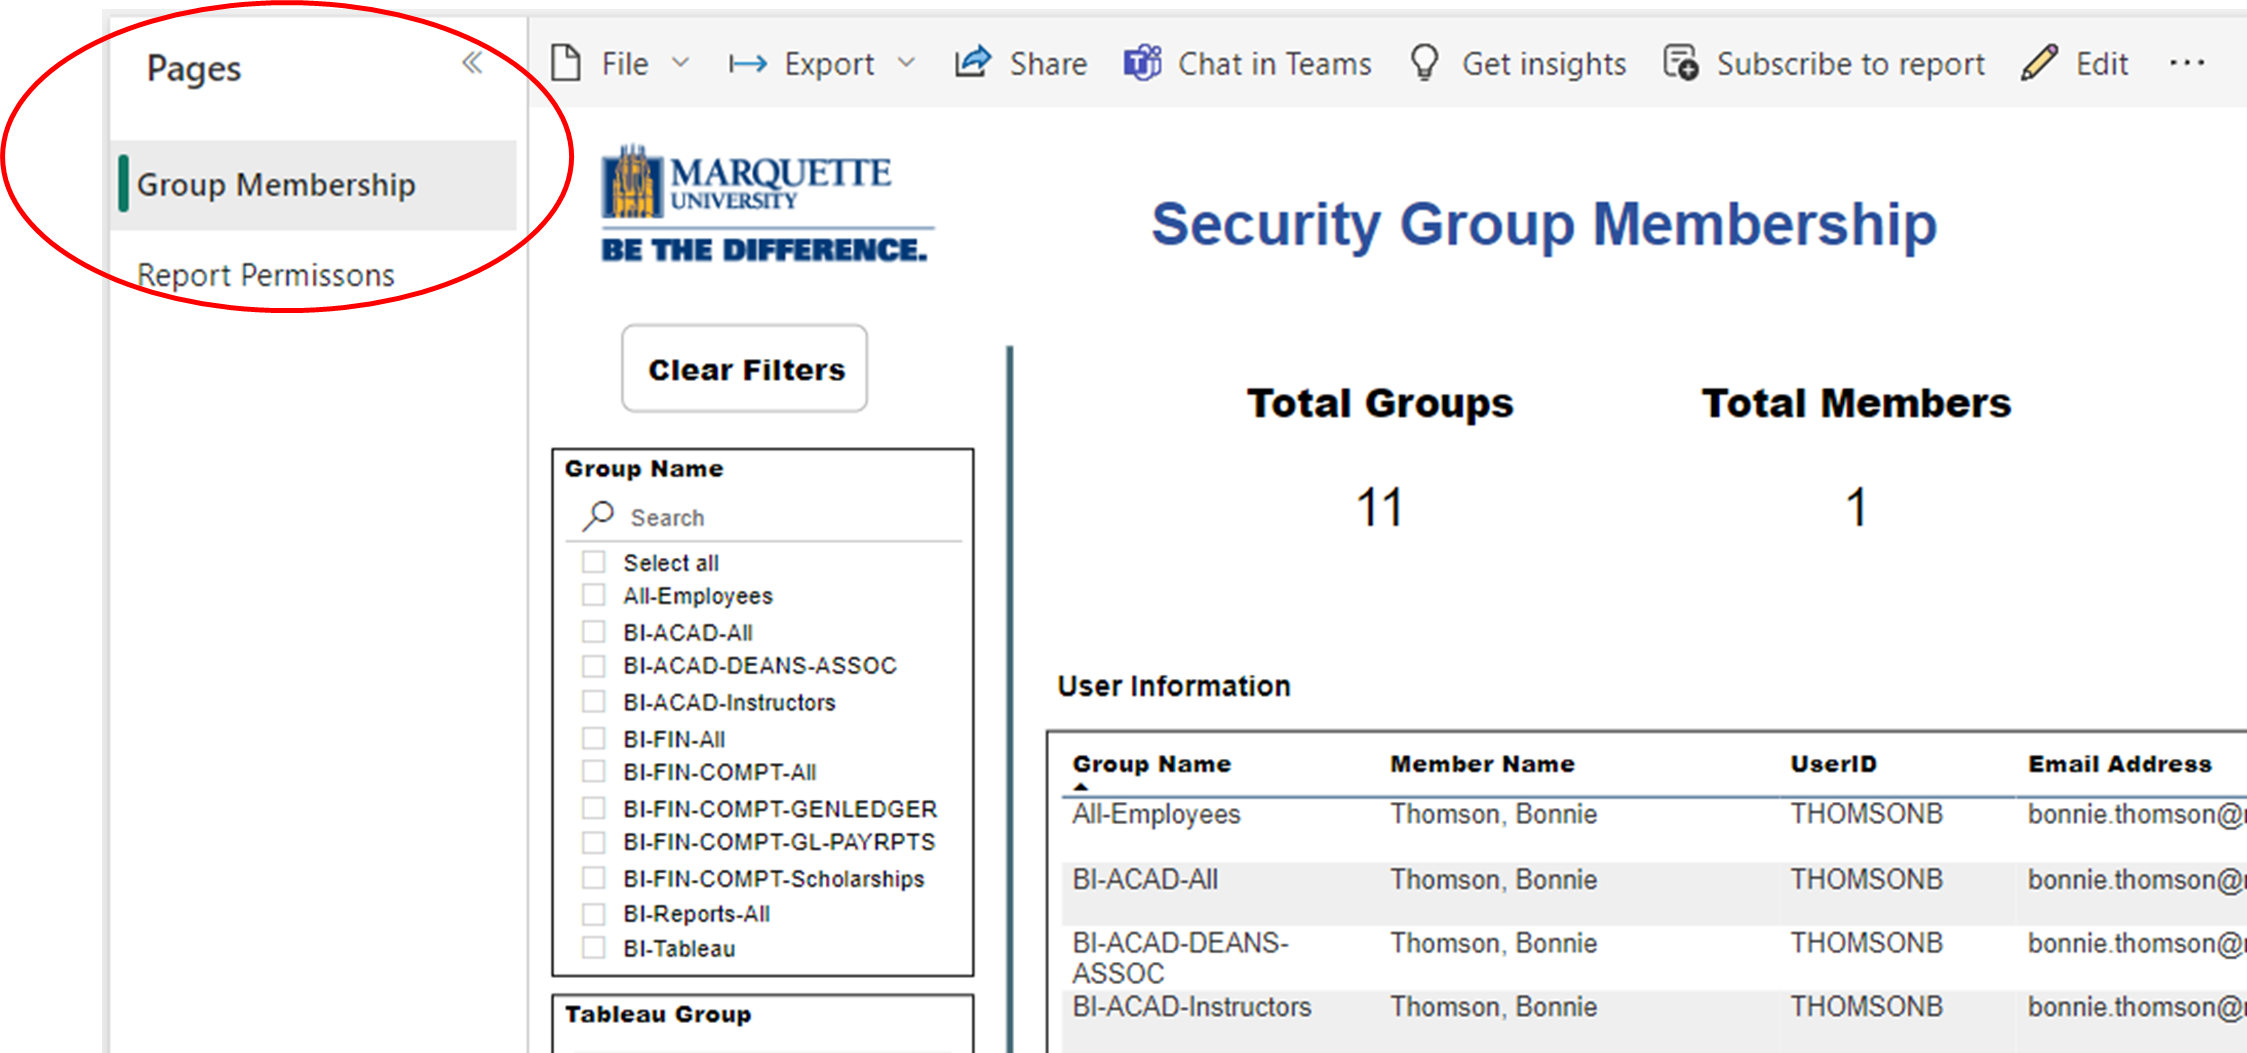
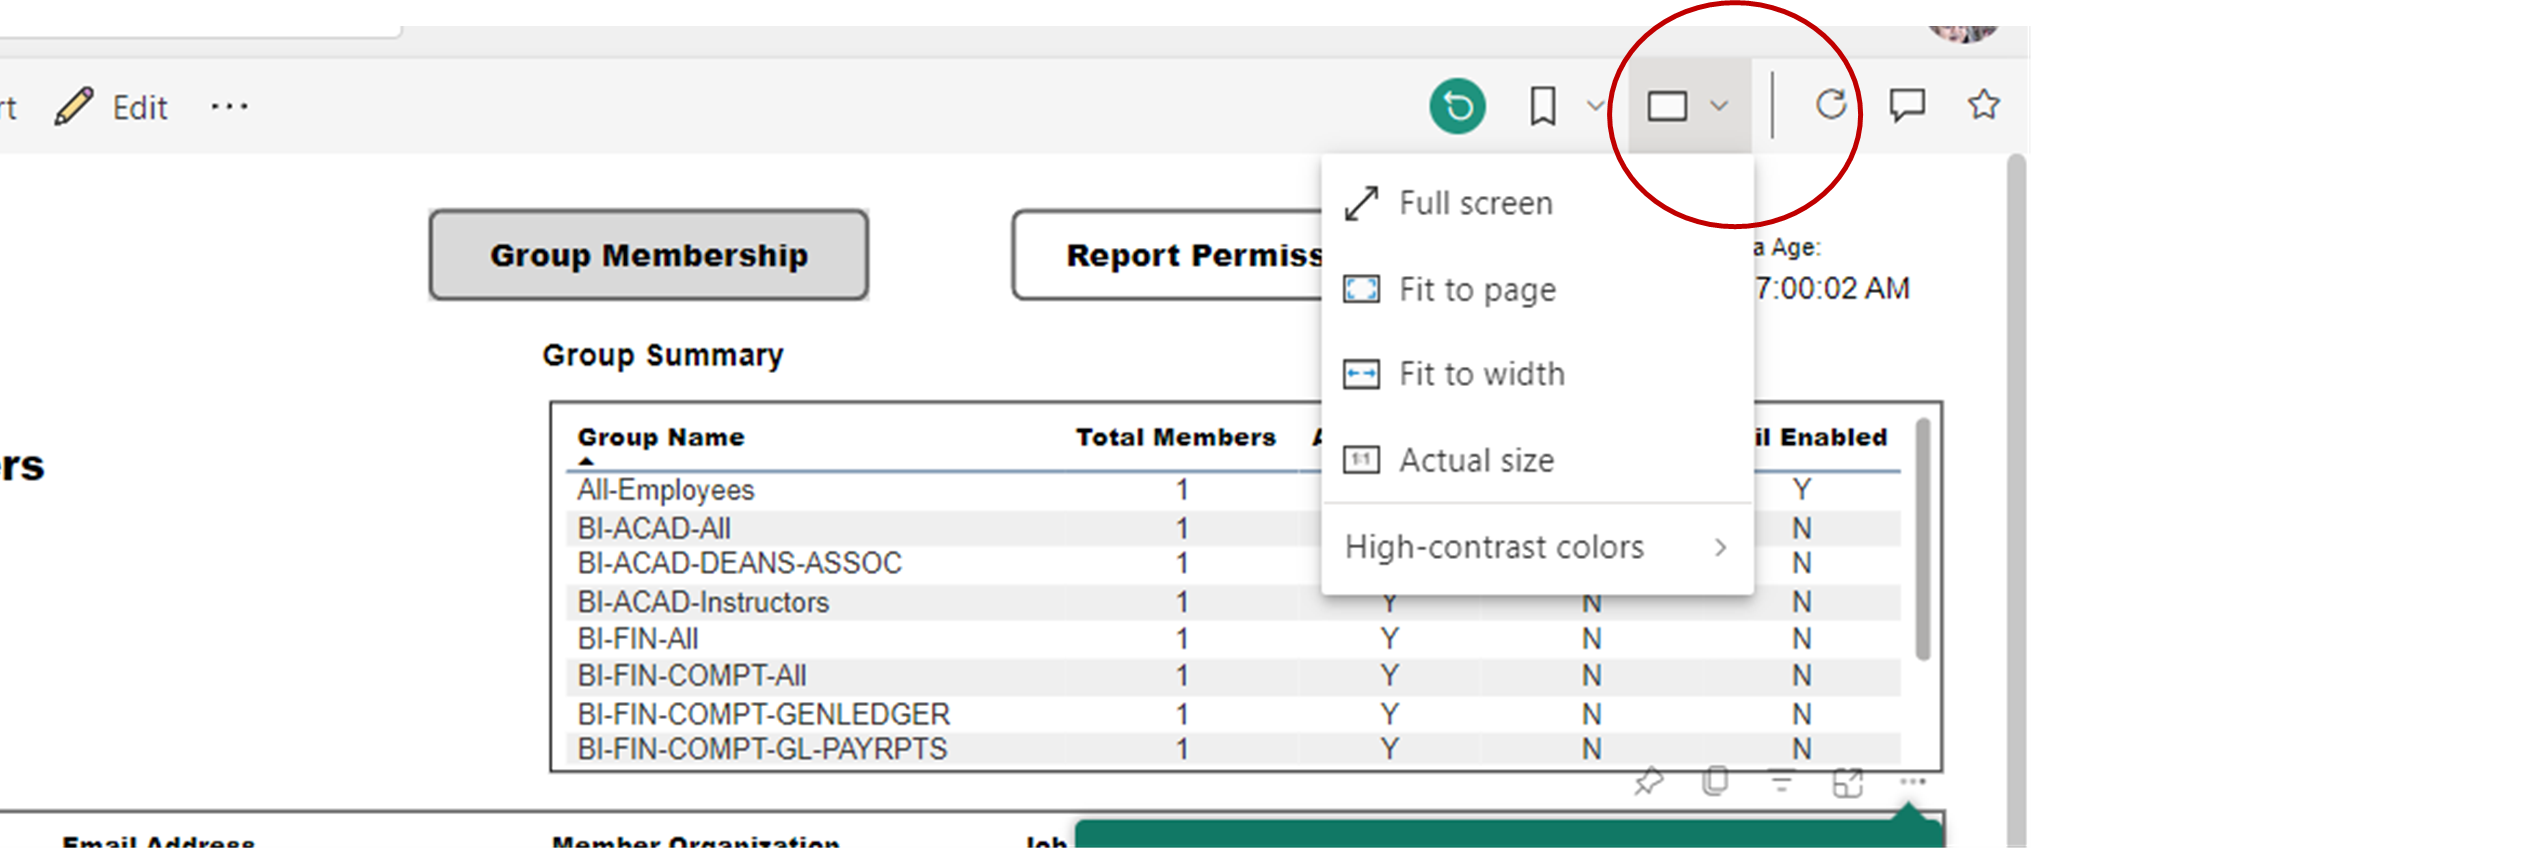
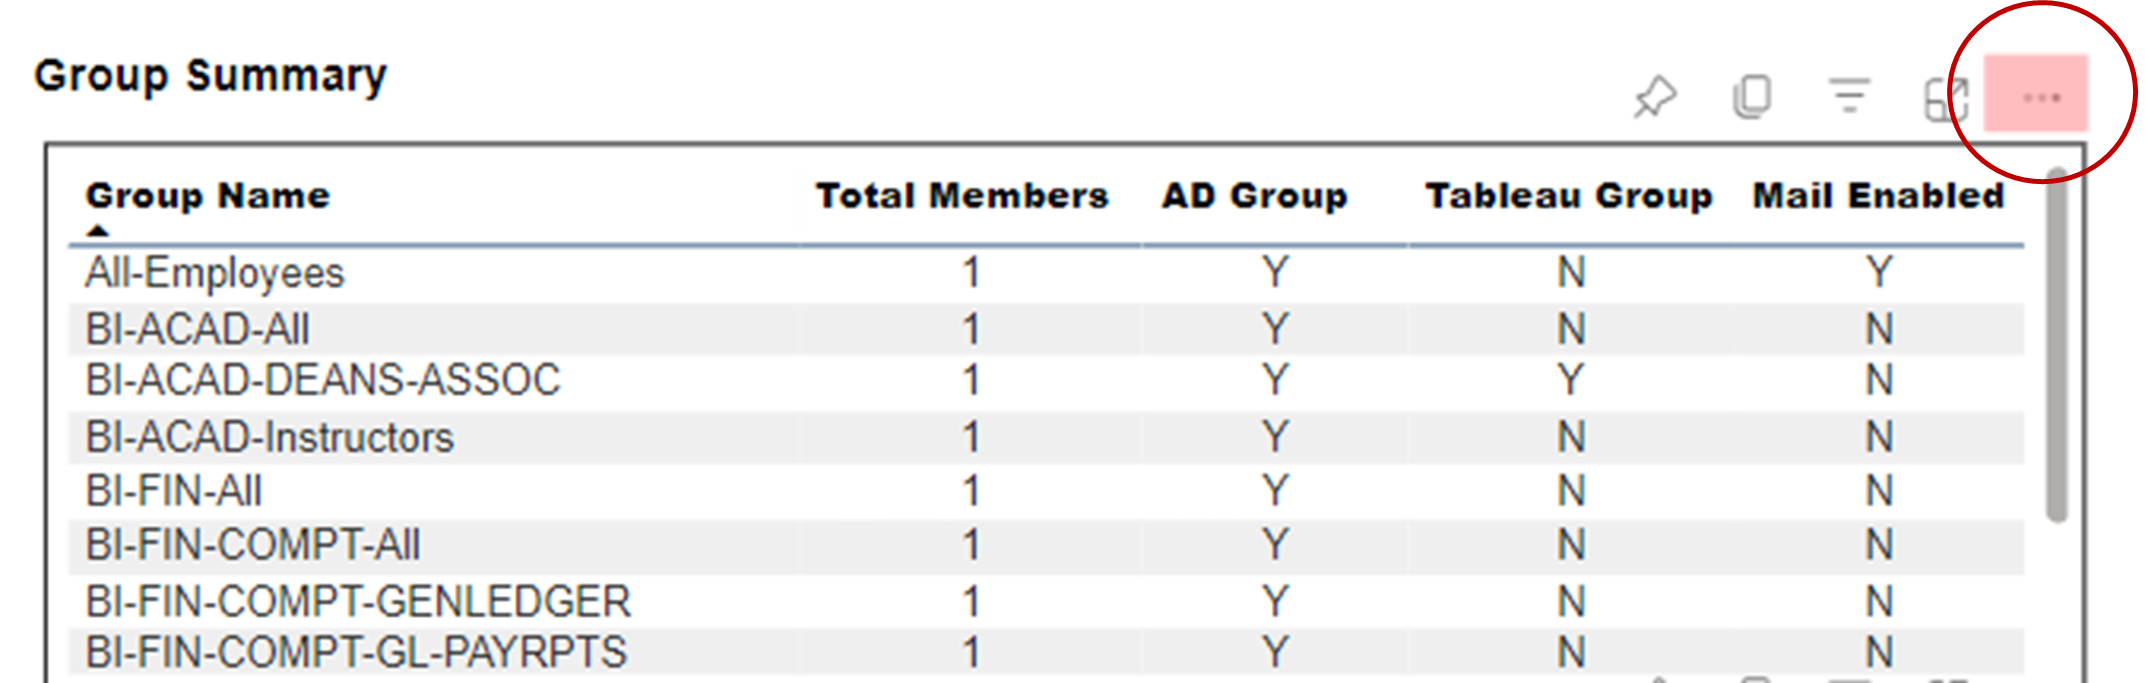
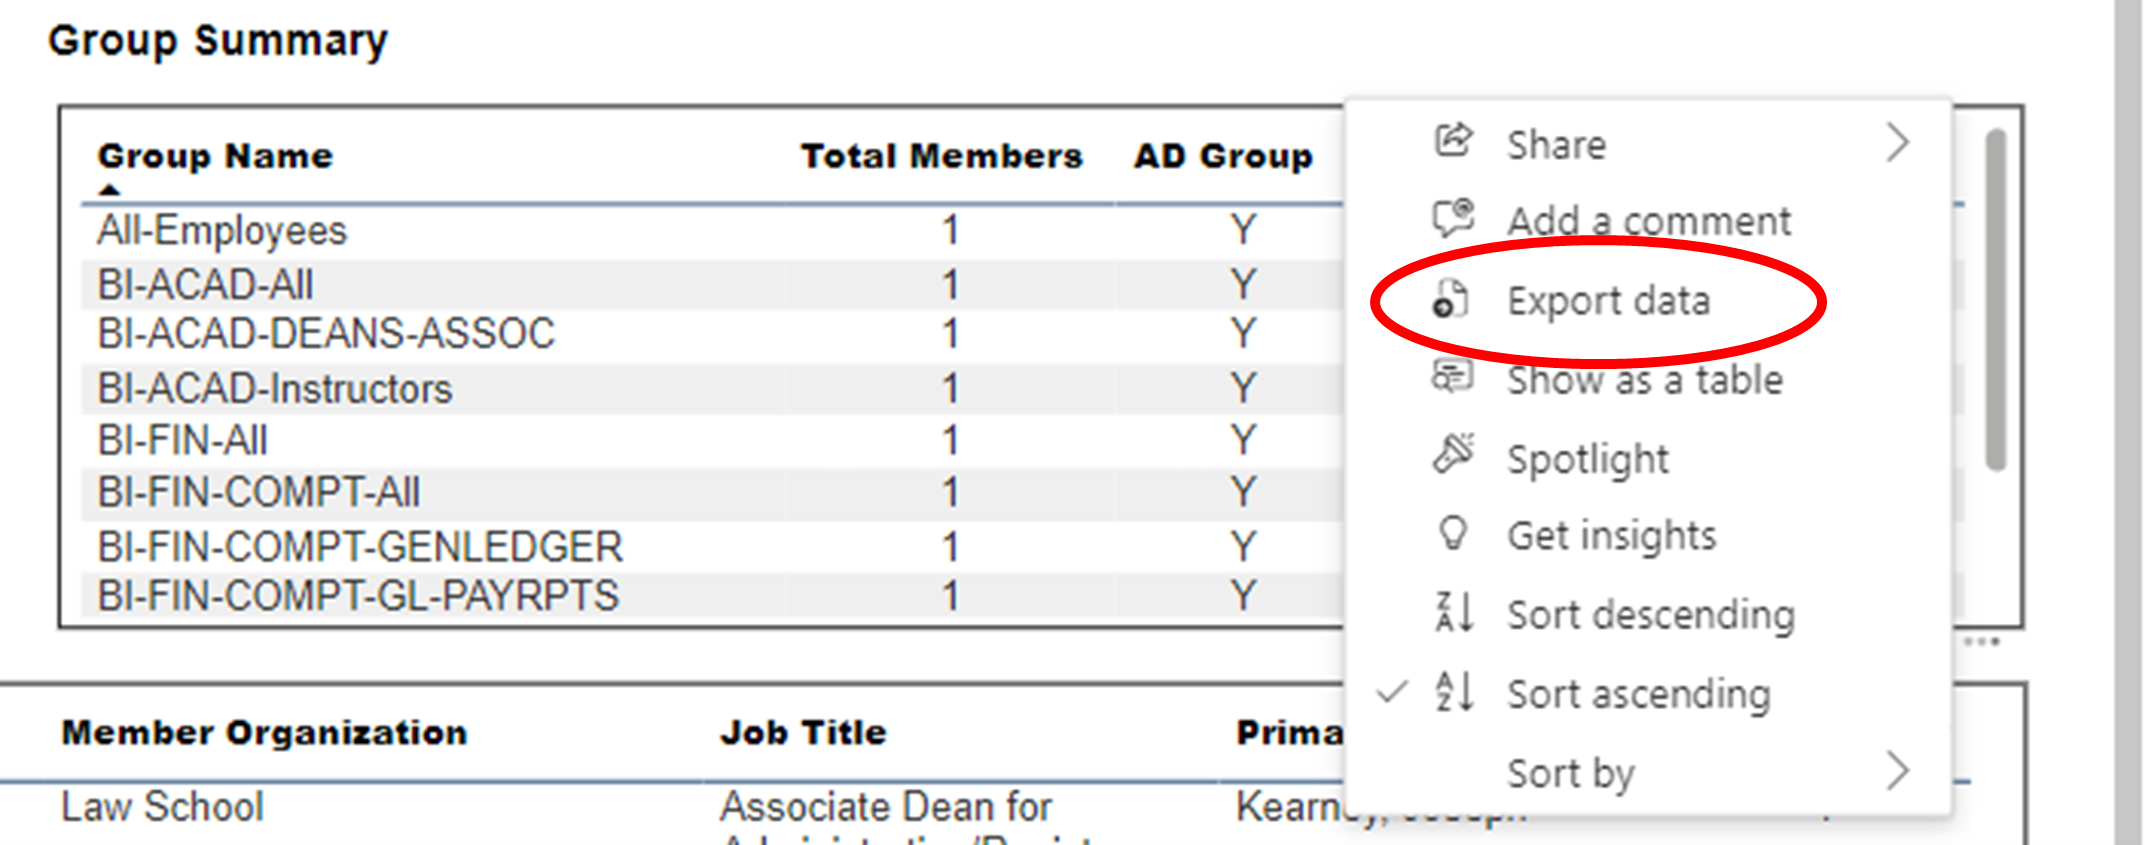
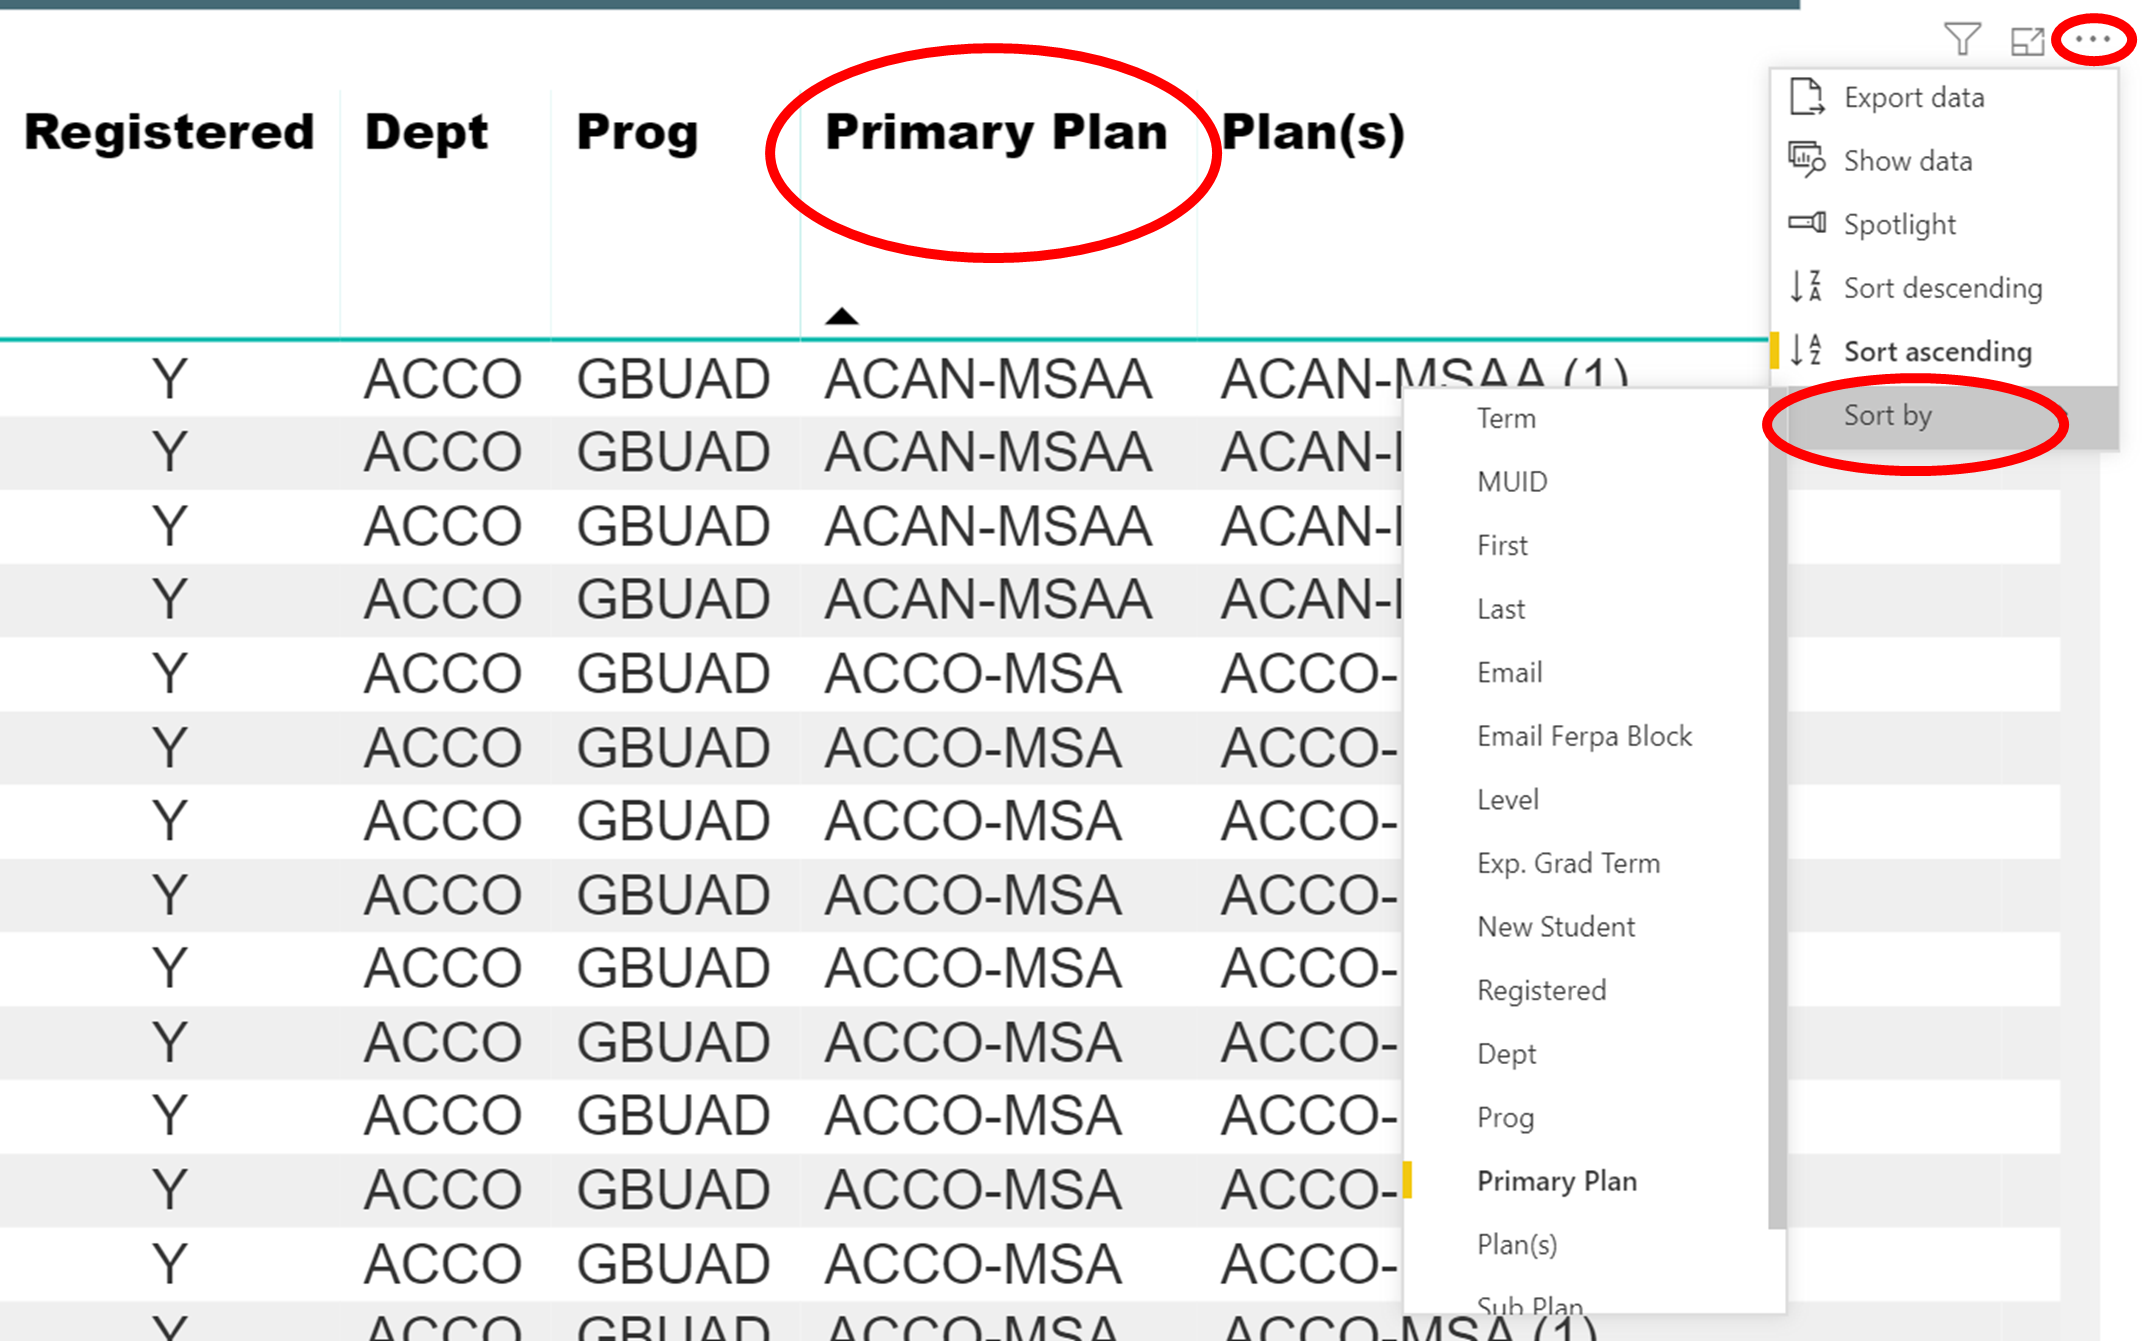
- Power BI Report User Guide
- Report Owner Catalog Guide
- Contact
Additional Resources
- Office of Institutional Research and Analysis
-
PROBLEM WITH THIS WEBPAGE?
Report an accessibility problem
To report another problem, please contact datamarq@marquette.edu.