Bias Incident Report Data July 2020 – June 2021
Marquette University is committed to creating a diverse, inclusive and welcoming environment for students, faculty, staff, alumni and visitors. Maintaining this sort of community requires all of us to learn about and address incidents of bias and discrimination on our campus.
These statistics are published in order for the Marquette University community to track, examine and understand the nature of bias incidents on our campus. Periodically, it is difficult to identify the perpetrator(s) of bias. However, when identifiable the University can conduct an investigate and hold the individual(s) accountable for their actions. By keeping a record we are able to understand trends and inform the community of the actions taken address the incident(s). In addition, publishing the data enables us to hold ourselves accountable and potentially take proactive measures to prevent future bias. More information on reporting options can be found online.
Aggregate Data
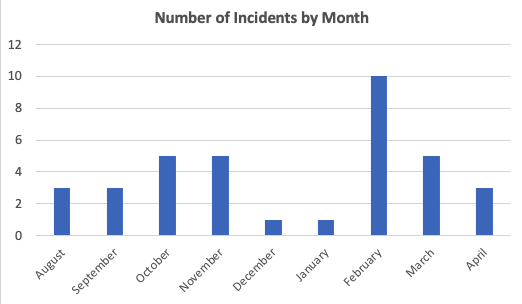
Reports by Month
|
Month
|
Number of Incidents
|
|
August
|
3
|
|
September
|
3
|
|
October
|
5
|
|
November
|
5
|
|
December
|
1
|
|
January
|
1
|
|
February
|
10
|
|
March
|
5
|
|
April
|
3
|
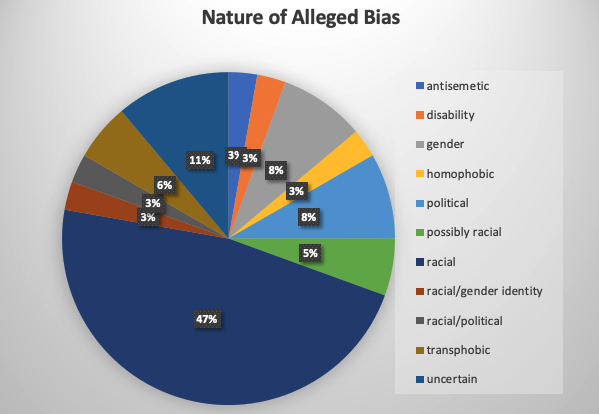
Incidents by Nature of Alleged Bias
|
antisemetic
|
1
|
|
disability
|
1
|
|
gender
|
3
|
|
homophobic
|
1
|
|
political
|
3
|
|
possibly racial
|
2
|
|
racial
|
17
|
|
racial/gender identity
|
1
|
|
racial/political
|
1
|
|
transphobic
|
2
|
|
uncertain
|
4
|
|
Total
|
36
|
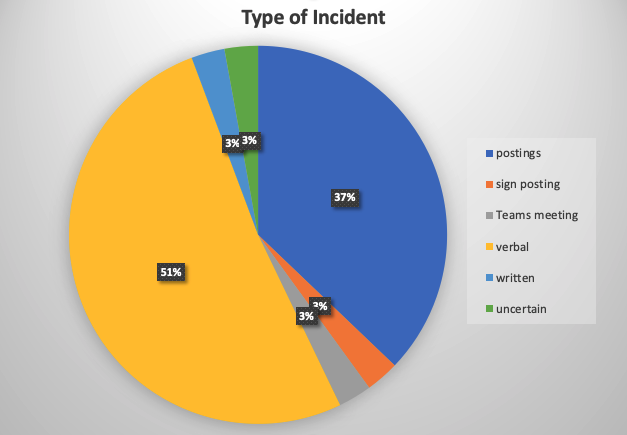
Incidents by Type
|
postings
|
13
|
|
sign posting
|
1
|
|
Teams meeting
|
1
|
|
verbal
|
18
|
|
written
|
1
|
|
uncertain
|
1
|
|
total
|
36
|
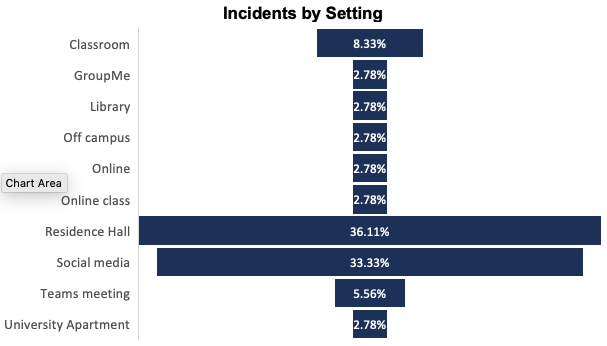
Incidents by Setting
|
Classroom
|
3
|
|
GroupMe
|
1
|
|
Library
|
1
|
|
Off campus
|
1
|
|
Online
|
1
|
|
Online class
|
1
|
|
Residence Hall
|
13
|
|
Social media
|
12
|
|
Teams meeting
|
2
|
|
University Apartment
|
1
|
|
Total
|
36
|
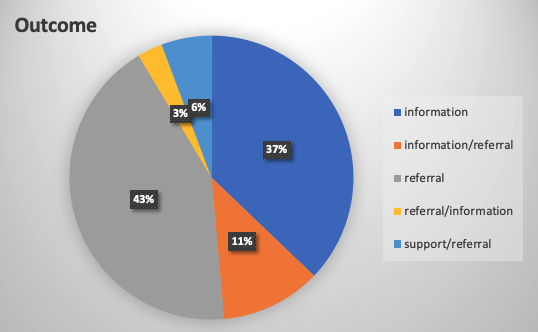
Outcome
|
information
|
13
|
|
information/referral
|
4
|
|
referral
|
15
|
|
referral/information
|
1
|
|
support/referral
|
2
|
|
Total
|
36
|
|
Incident Date
|
Targeted Identity
|
Type of Incident
|
Setting
|
Information Only or for Support/Referral
|
| 8/12/20 |
possibly racial |
verbal |
Residence Hall |
referral |
| 8/17/20 |
gender |
verbal |
Residence Hall |
referral |
| 8/30/20 |
racial |
postings |
social media |
referral/information |
| 9/11/20 |
political |
postings |
social media |
referral |
| 9/25/20 |
racial |
postings |
social media |
information/referral |
| 9/26/20 |
none |
|
University Apartment |
information |
| 10/2/20 |
racial |
verbal |
Library |
information/referral |
| 10/2/20 |
gender |
verbal |
Residence Hall |
information |
| 10/5/20 |
possibly racial |
written |
Residence Hall |
information/referral |
| 10/8/20 |
racial |
verbal |
Residence Hall |
referral |
| 10/25/20 |
racial |
verbal |
Off campus |
information |
| 11/5/20 |
political |
sign posting |
Residence Hall |
information |
| 11/9/20 |
racial |
verbal |
Residence Hall |
information/referral |
| 11/10/20 |
uncertain |
verbal |
Teams meeting |
information |
| 11/19/20 |
racial |
verbal |
Teams meeting |
referral |
| 11/22/20 |
political |
postings |
social media |
support/referral |
| 12/11/20 |
racial/political |
verbal |
Residence Hall |
information |
| 1/8/21 |
racial/gender identity |
Teams meeting |
online |
information |
| 2/4/21 |
racial |
verbal |
Residence Hall |
referral |
| 2/5/21 |
racial |
verbal |
Residence Hall |
support/referral |
| 2/11/21 |
racial |
verbal |
online class |
referral |
| 2/11/21 |
transphobic |
postings |
social media |
information |
| 2/12/21 |
racial |
verbal |
classroom |
referral |
| 2/15/21 |
racial |
postings |
social media |
referral |
| 2/19/21 |
uncertain |
postings |
social media |
information |
| 2/20/21 |
uncertain |
postings |
social media |
information |
| 2/23/21 |
racial |
verbal |
Residence Hall |
referral |
| 2/23/21 |
gender |
postings |
social media |
referral |
| 3/11/21 |
racial |
verbal |
classroom |
referral |
| 3/11/21 |
racial |
verbal |
classroom |
referral |
| 3/16/21 |
transphobic |
postings |
social media |
referral |
| 3/27/21 |
disability |
postings |
social media |
referral |
| 3/28/21 |
racial |
verbal |
Residence Hall |
information |
| 4/7/21 |
antisemetic |
postings |
social media |
information |
| 4/8/21 |
homophobic |
verbal |
Residence Hall |
information |
| 4/17/21 |
racial |
postings |
GroupMe |
information |
Learn more about outcomes of the reporting system.